Monitor Azure subscription resources with cost and usage tracking and reports
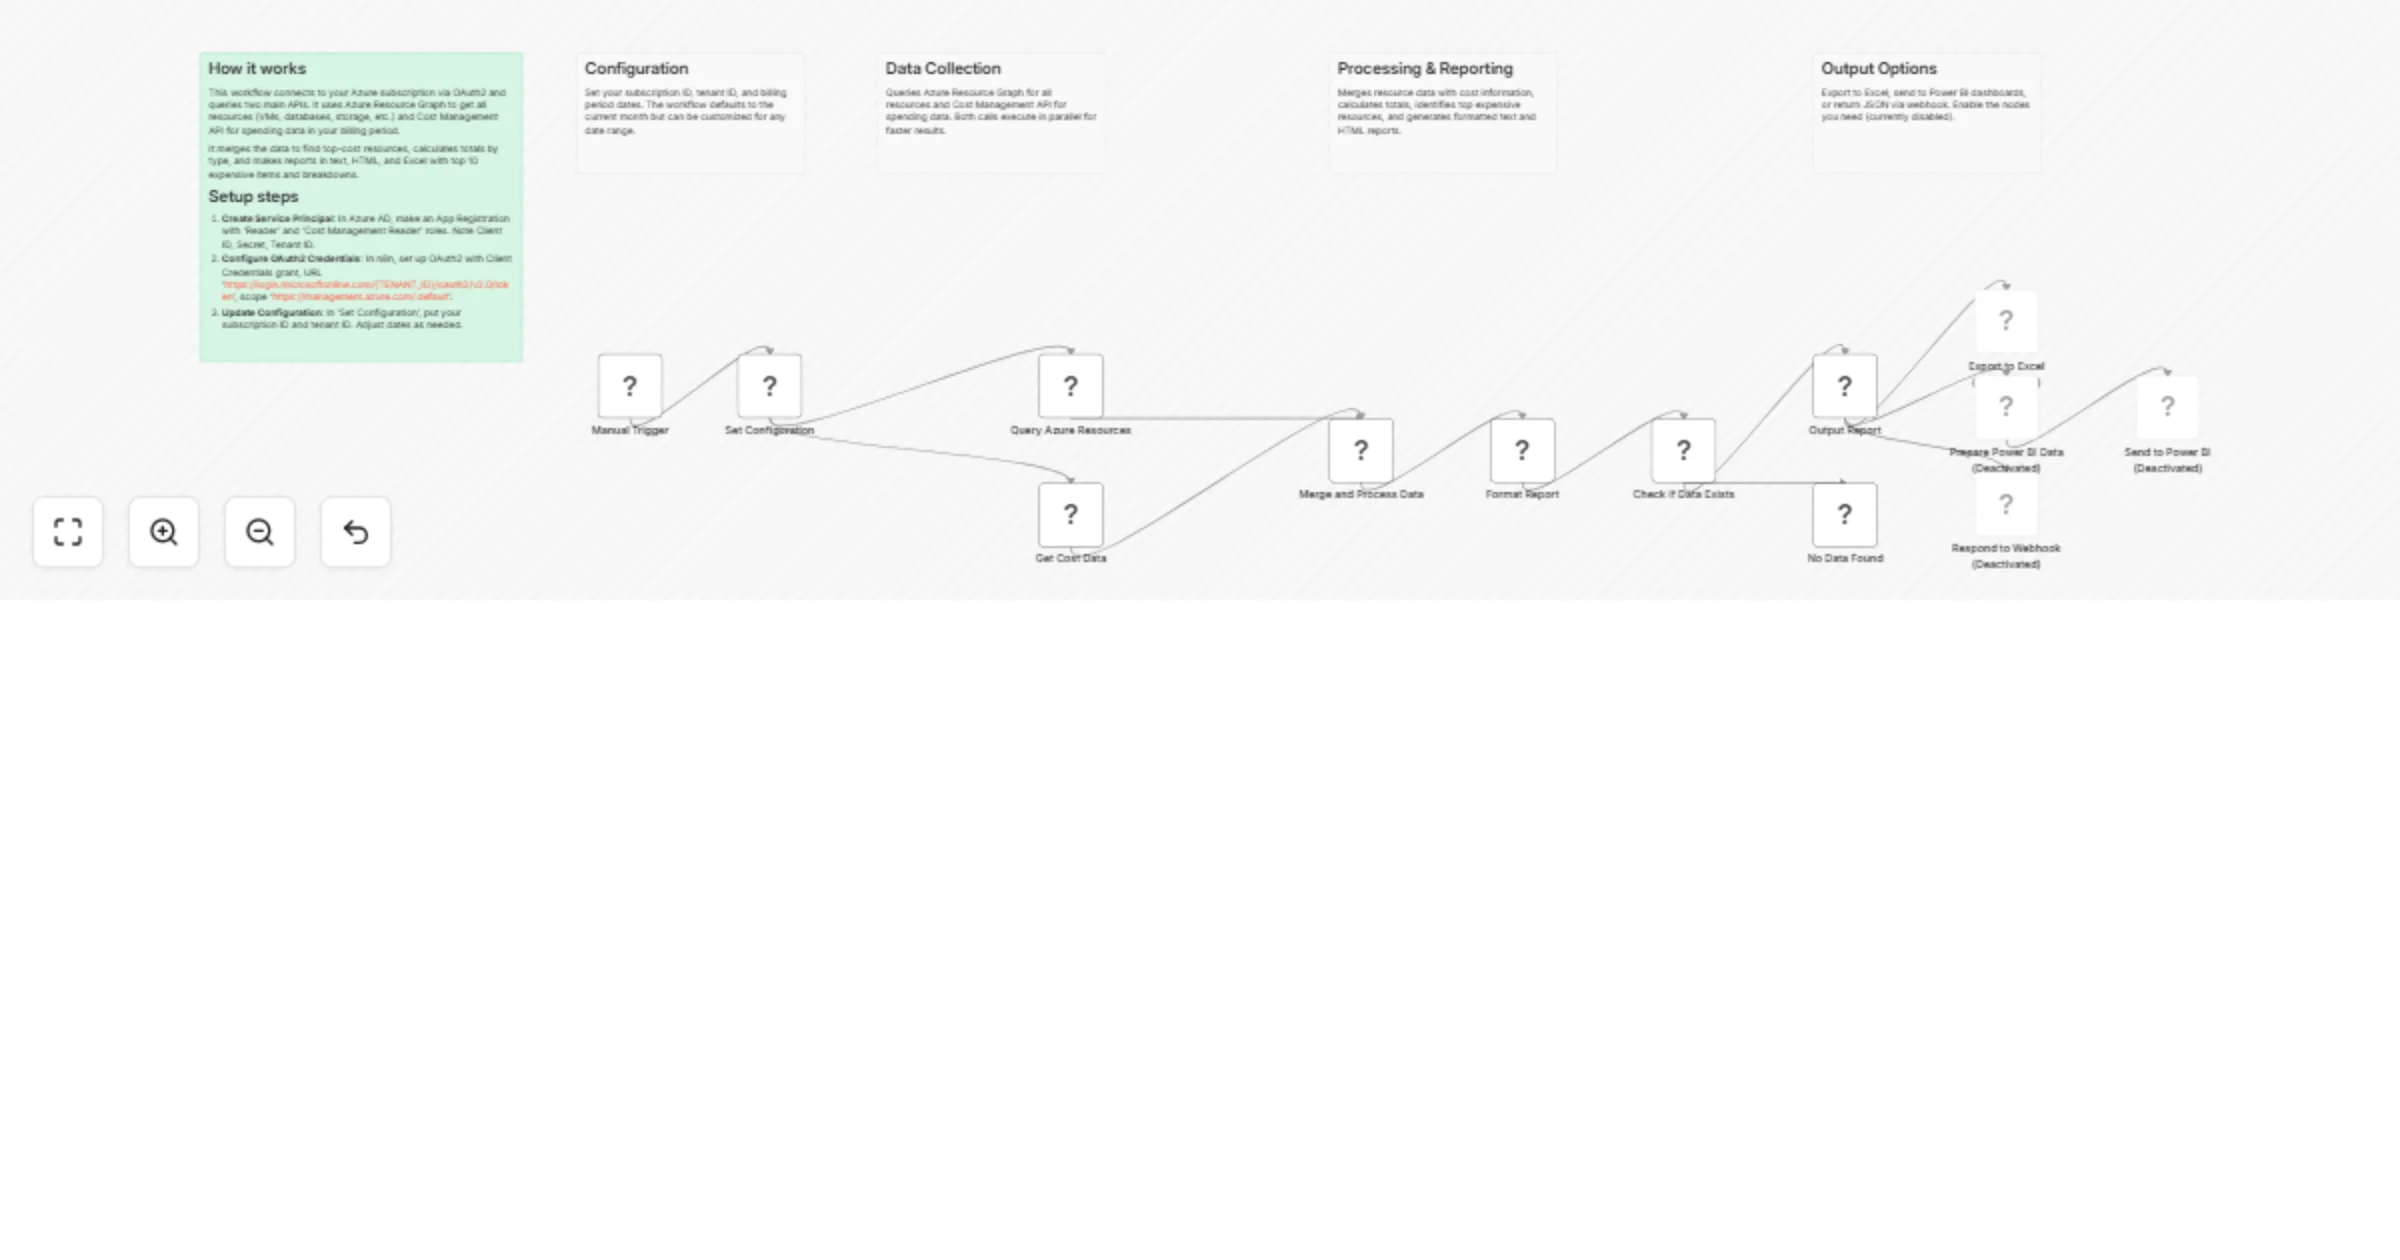
Workflow preview
DISCOUNT 20%
Overview
Monitor Azure subscription resources with cost and usage tracking
Template Name
Monitor Azure subscription resources with cost and usage tracking
Description
Automatically connect to your Azure subscription to retrieve all resources and track costs. Generates formatted reports with total spending, top expensive resources, and cost breakdown by type.
Who's it for
DevOps Engineers, Cloud Architects, Finance Teams, IT Managers, and organizations implementing FinOps practices.
How it works
- Authentication: OAuth2 Service Principal with Azure
- Resource Discovery: Queries Azure Resource Graph API
- Cost Retrieval: Fetches data from Cost Management API
- Data Processing: Merges resources with costs
- Report Generation: Creates text/HTML reports
- Output: Excel export, Power BI streaming, or API/Webhook response
Set up steps
Prerequisites
- Azure Subscription with appropriate permissions
- Azure Service Principal with Reader and Cost Management Reader roles
Setup
1. Create Azure Service Principal
Azure CLI:
az ad sp create-for-rbac --name "n8n-cost-monitor" --role "Reader" --scopes /subscriptions/{sub-id}
az role assignment create --assignee {client-id} --role "Cost Management Reader" --scope /subscriptions/{sub-id}
Or use Azure Portal: Azure AD → App registrations → New registration → Assign roles
2. Configure n8n OAuth2 Credential
- Credentials → OAuth2 API
- Grant Type: Client Credentials
- Access Token URL:
https://login.microsoftonline.com/{TENANT_ID}/oauth2/v2.0/token - Scope:
https://management.azure.com/.default
3. Update Workflow Configuration
- Open "Set Configuration" node
- Update
subscriptionIdandtenantId - Set
timeRange(see options below) - Assign OAuth2 credential to HTTP nodes
Time Range Options:
currentMonth- Current billing month (default)lastMonth- Previous full monthlast30Days- Last 30 dayslast90Days- Last 90 days (3 months)last6Months- Last 6 monthsyearToDate- From Jan 1 to todaylastYear- Full previous year (365 days)custom- Manually set startDate and endDate
4. Enable Output Options (Optional)
- Excel: Enable "Export to Excel" node for .xlsx downloads
- Power BI: Enable "Prepare Power BI Data" and "Send to Power BI" nodes with Push URL
- API/Webhook: Enable "Respond to Webhook" node and change trigger to Webhook
5. Schedule (Optional)
Replace Manual Trigger with Schedule Trigger (daily: 0 9 * * *)
Requirements
Azure Requirements
- Active Azure subscription
- Permissions to create Service Principal
- Permissions to assign Reader and Cost Management Reader roles
n8n Requirements
- n8n instance (cloud or self-hosted version 1.0+)
- Ability to create OAuth2 credentials
Optional Requirements
- Slack workspace (for Slack notifications)
- Email service credentials (for email reports)
- Database instance (for data storage)
How to customize the workflow
Enable Output Options
The workflow includes three disabled output nodes. To enable them:
- Click on the node (Excel Export, Power BI, or Webhook Response)
- Click the three dots menu → Enable
- Configure the node settings as needed
Excel Export Configuration
The Excel export node is pre-configured but disabled. To use it:
// Already configured to export:
- All resources with their costs
- Formatted as Excel (.xlsx)
- Filename includes current date
- Headers included automatically
To customize:
- Change filename pattern in the node settings
- Add/remove columns by modifying the data mapping
- Export to CSV instead by changing the file extension
Power BI Integration
Step 1: Create Power BI Streaming Dataset
- Go to Power BI workspace
- Create New → Streaming dataset → API
- Define schema:
{
 "summary": {
 "totalCost": "string",
 "resourceCount": "number",
 "period": "string"
 },
 "resources": [
 {
 "resourceName": "string",
 "resourceType": "string",
 "cost": "string"
 }
 ],
 "timestamp": "datetime",
 "reportType": "string"
}
- Copy the Push URL
Step 2: Configure n8n Workflow
- Enable "Prepare Power BI Data" node
- Enable "Send to Power BI" node
- Update the URL in "Send to Power BI" node with your Push URL
- Test the workflow
Step 3: Create Power BI Dashboard
- Create visualizations from the streaming dataset
- Add cards for Total Cost, Resource Count
- Add tables for Top Resources
- Add charts for Cost by Type
API Response / Webhook Mode
To use the workflow as an API endpoint:
Step 1: Change Trigger
- Delete "Manual Trigger" node
- Add "Webhook" trigger node
- Choose GET or POST method
- Copy the webhook URL
Step 2: Enable Response Node
- Azure subscription with Service Principal permissions
- n8n 1.0+ (cloud or self-hosted)
- OAuth2 credentials capability import requests response = requests.get("https://your-n8n-instance.com/webhook/azure-cost-report") data = response.json() print(f"Total Cost: ${data['data']['totalCost']}")
**Response Format:**

```json
{
 "status": "success",
 "data": {

### Enable Output Options

Right-click disabled nodes → Enable → Configure settings

### Filter Resources

Modify query in "Query Azure Resources" node:

```kusto
Resources
| where resourceGroup contains 'production'
| project name, type, location, resourceGroup, tags, id
Change Time Range
Set timeRange in "Set Configuration" node:
timeRange: "last30Days" // Last 30 days
timeRange: "last90Days" // Last quarter
timeRange: "last6Months" // Last 6 months
timeRange: "yearToDate" // YTD from Jan 1
timeRange: "lastYear" // Previous 365 days
timeRange: "custom" // Use custom dates
For custom periods, set timeRange to "custom" and manually update:
startDate: "2026-01-01"
endDate: "2026-01-31"
Add Cost Alerts
{{ parseFloat($json.summary.totalCost) > 1000 }}
Troubleshooting
Common Issues
"Authentication failed"
- Verify your Tenant ID is correct
- Check that Client ID and Secret are valid
- Ensure the Service Principal has the required roles
"No resources returned"
- Verify the Subscription ID is correct
- Check that Service Principal has Reader role
- Try running the query in Azure Resource Graph Explorer first
"No cost data available"
- Cost data may take 24-48 hours to appear
- VeAdjust Cost Period
In "Set Configuration" node:
// Last 7 days
startDate: {{ $now.minus({days: 7}).format('yyyy-MM-dd') }}
endDate: {{ $now.format('yyyy-MM-dd') }}
Add Cost Alerts
Add IF node after "Format Report":
{{ parseFloat($json.summary.totalCost) > 1000 }2. **Microsoft.Sql/servers/databases** - 3 resources - $345.67
...

---
_Generated by n8n on 1/19/2026, 10:30:00 AM_
HTML Report Format
Includes styled HTML with:
- Professional color scheme (Azure blue #0078D4)
- Responsive tables
- Summary cards with highlighted metrics
- Sortable columns
- Even row highlighting for readability
Excel Export Columns
| Column | Type | Description |
|---|---|---|
| resourceName | String | Name of the Azure resource |
| resourceType | String | Full resource type (e.g., Microsoft.Compute/virtualMachines) |
| resourceGroup | String | Resource group name |
| location | String | Azure region (e.g., eastus, westus2) |
| sku | Object | SKU information (name, tier) |
| tags | Object | All resource tags |
| cost | Number | Total cost for the period |
| costDetails | Array | Detailed daily cost breakdown |
Power BI Data Schema
Recommended Power BI measures:
Total Cost = SUM('CostData'[cost])
Avg Cost Per Resource = DIVIDE([Total Cost], COUNT('CostData'[resourceName]))
Cost Variance = [Total Cost] - CALCULATE([Total Cost], DATEADD('CostData'[timestamp], -1, MONTH))
Top 5 Expensive Resources = TOPN(5, 'CostData', 'CostData'[cost], DESC)
Integration Examples
Python Integration
import requests
import pandas as pd

# Call the n8n webhook
url = "https://your-n8n-instance.com/webhook/azure-cost-report"
response = requests.get(url)
data = response.json()

# Convert to DataFrame
resources_df = pd.DataFrame(data['data']['summary']['allResources'])

# Analyze costs
print(f"Total Cost: ${data['data']['totalCost']}")
print(f"Most expensive resource: {resources_df.iloc[0]['resourceName']}")

# Export to local Excel
resources_df.to_excel('azure_costs.xlsx', index=False)
PowerShell Integration
# Call the webhook
$url = "https://your-n8n-instance.com/webhook/azure-cost-report"
$response = Invoke-RestMethod -Uri $url -Method Get

# Display summary
Write-Host "Total Cost: $($response.data.totalCost)" -ForegroundColor Green
Write-Host "Resource Count: $($response.data.resourceCount)"

# Export to CSV
$response.data.summary.allResources |
 Export-Csv -Path "azure-costs.csv" -NoTypeInformation

# Send alert if cost exceeds threshold
if ([decimal]$response.data.totalCost -gt 1000) {
 Send-MailMessage -To "[email protected]" `
 -Subject "Azure Cost Alert" `
 -Body "Current costs: $($response.data.totalCost)" `
 -SmtpServer "smtp.company.com"
}
JavaScript/Node.js Integration
const axios = require('axios');

**"Authentication failed"**: Verify Tenant ID, Client ID, Secret, and Service Principal roles

**"No resources returned"**: Check Subscription ID and Reader role assignment

**"No cost data"**: Cost data takes 24-48 hours to appear. Verify Cost Management Reader role.

**"Rate limiting (429)"**: Add Wait node between API calls or reduce query frequency

## Resources

- [Azure Resource Graph](https://learn.microsoft.com/azure/governance/resource-graph/)
- [Cost Management API](https://learn.microsoft.com/rest/api/cost-management/)
- [n8n Documentation](https://docs.n8n.io/---

**Category**: Cloud Management, DevOps, FinOps
**Difficulty**: Intermediate
**Setup Time**: 10-15 minutes
**n8n Version**: 1.0+