Generate weekly Brevo campaign analytics reports with Groq and Google Sheets
Workflow preview
DISCOUNT 20%
Overview
How it works:
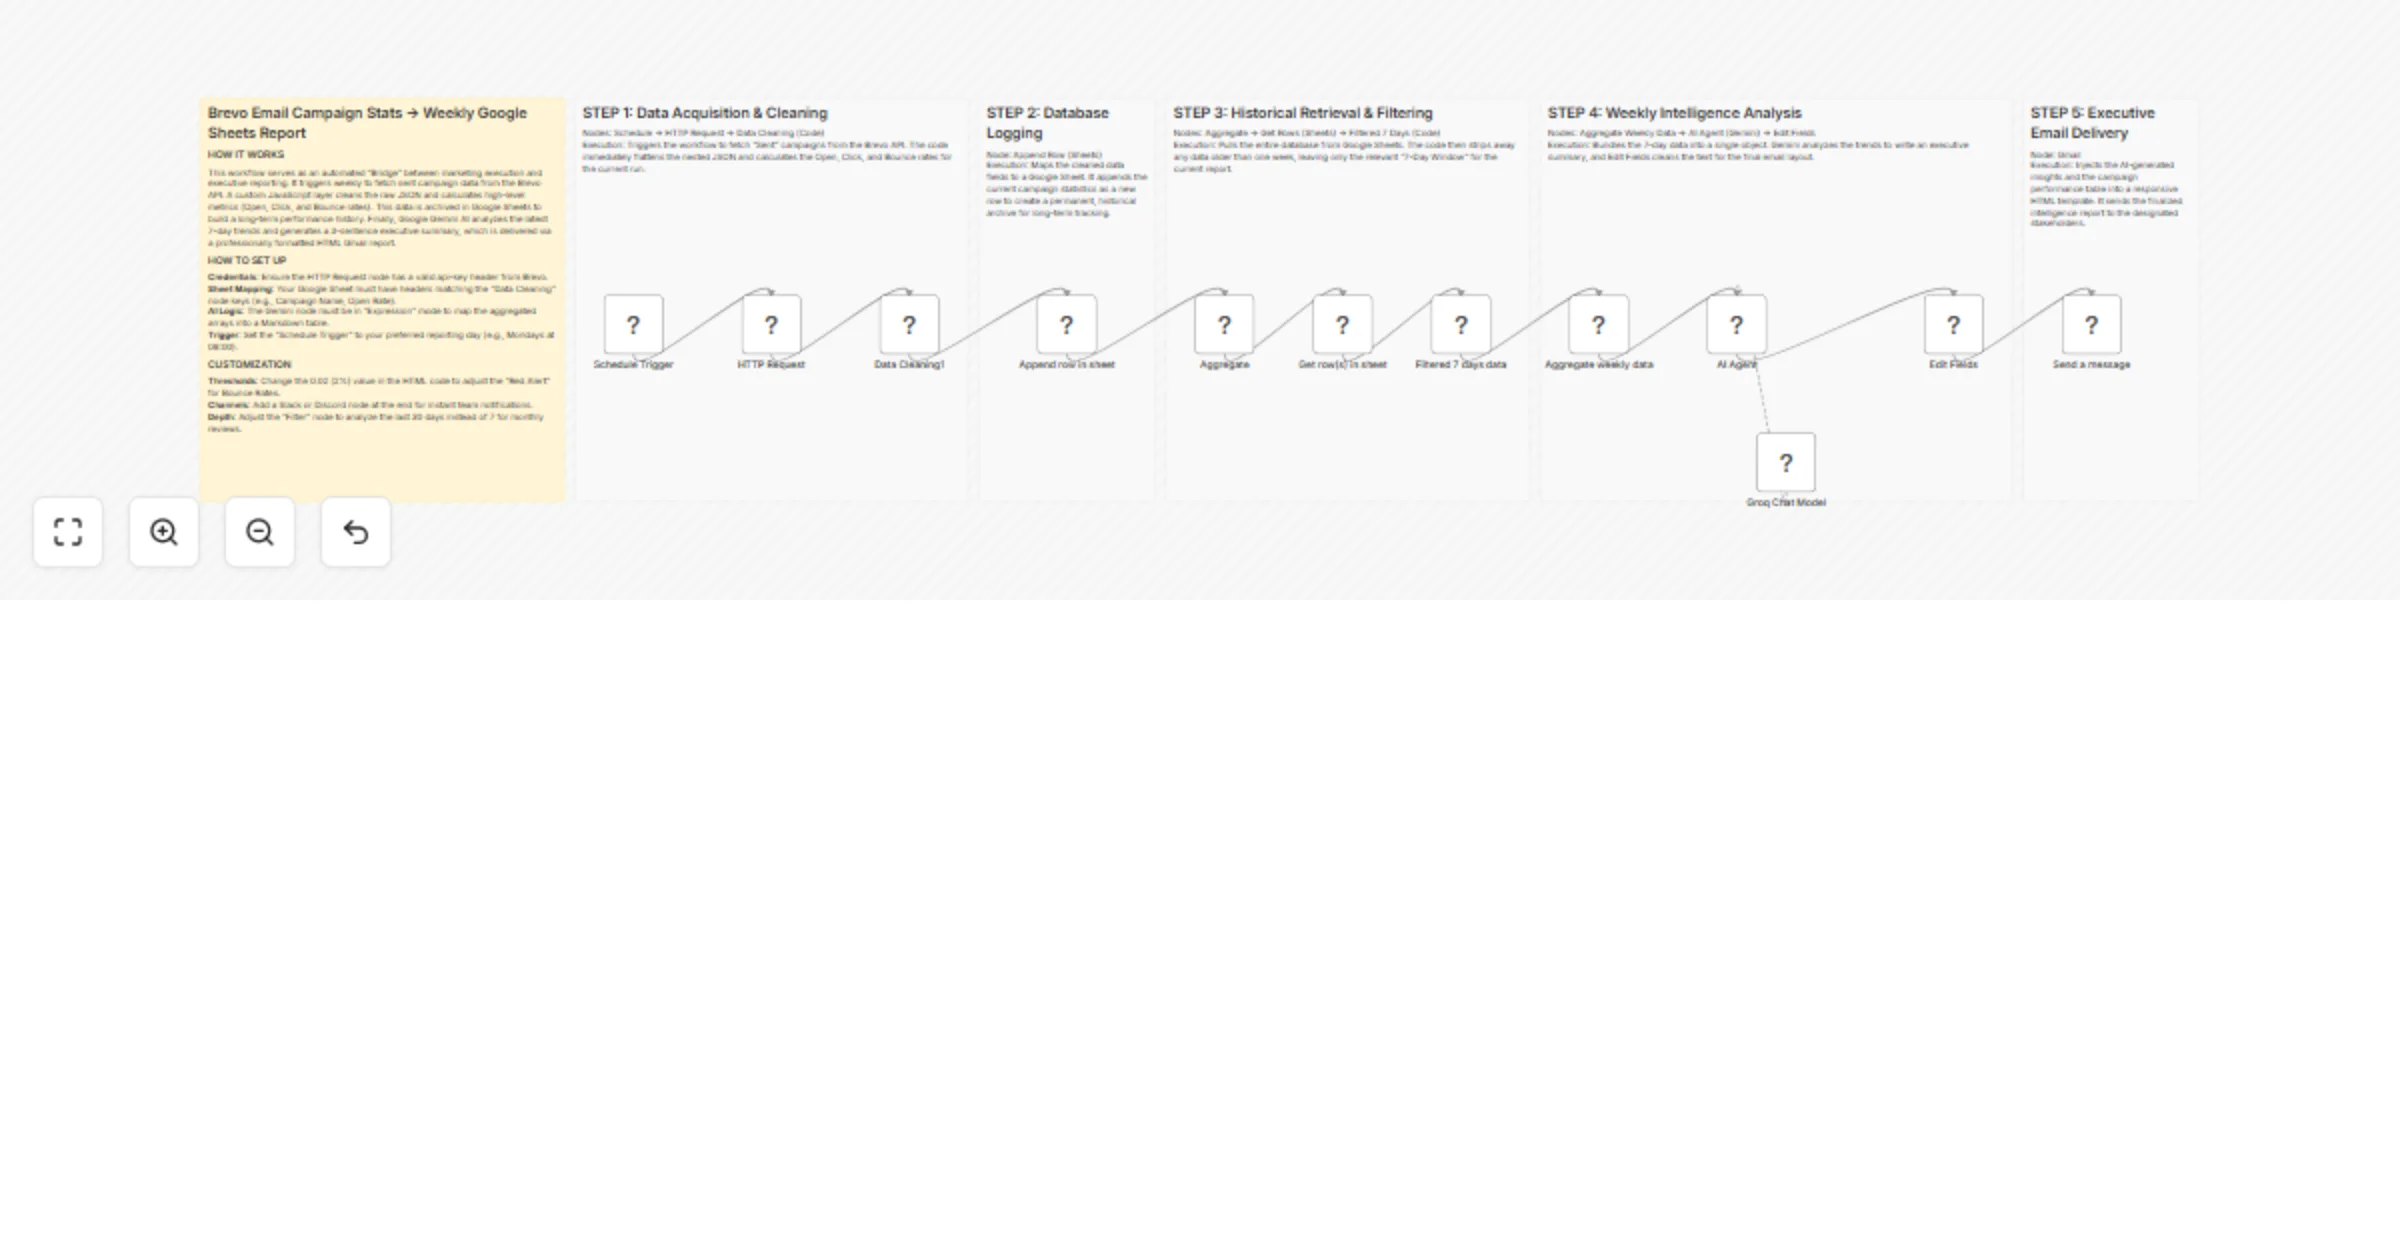
This workflow fetches sent campaign data from Brevo on a schedule, calculates key metrics (open rate, click rate, bounce rate), and stores results in Google Sheets. It then filters to a rolling 7-day window, runs an AI analysis to generate an executive summary with performance highlights and recommendations, and delivers a structured HTML report by email to stakeholders.
Step-by-step:
Data collection
Schedule Trigger – Fires the workflow on your chosen day and time.
HTTP Request (Brevo) – Fetches sent campaign data via the Brevo API.
Transform Data – Calculates open rate, click rate, and bounce rate per campaign.
Write to Google Sheets – Appends processed results to the historical database.
Data preparation
Read from Google Sheets – Retrieves the latest stored campaign records.
Filter to 7-day window – Narrows data to the last 7 days for trend analysis.
Aggregate Results – Summarises campaign performance across the window.
AI analysis
AI Summary Engine – Evaluates trends and generates an executive summary.
LLM (Groq or alternative) – Provides the AI model for analysis.
Format AI Output – Structures the summary for use in the report.
Report delivery
Build HTML Report – Compiles metrics, highlights, and recommendations into a styled email.
Send via Gmail – Delivers the final report to stakeholder recipients.
Why use this?
- Automates the full reporting lifecycle from data pull to inbox delivery.
- Surfaces top-performing campaigns and list health issues without manual review.
- Keeps a growing historical database for long-term trend tracking.
- Easily adjustable reporting window, thresholds, and notification channels.
- Works with any AI provider — swap Groq for any compatible LLM.