Monitor server uptime & get email alerts with Google Sheets
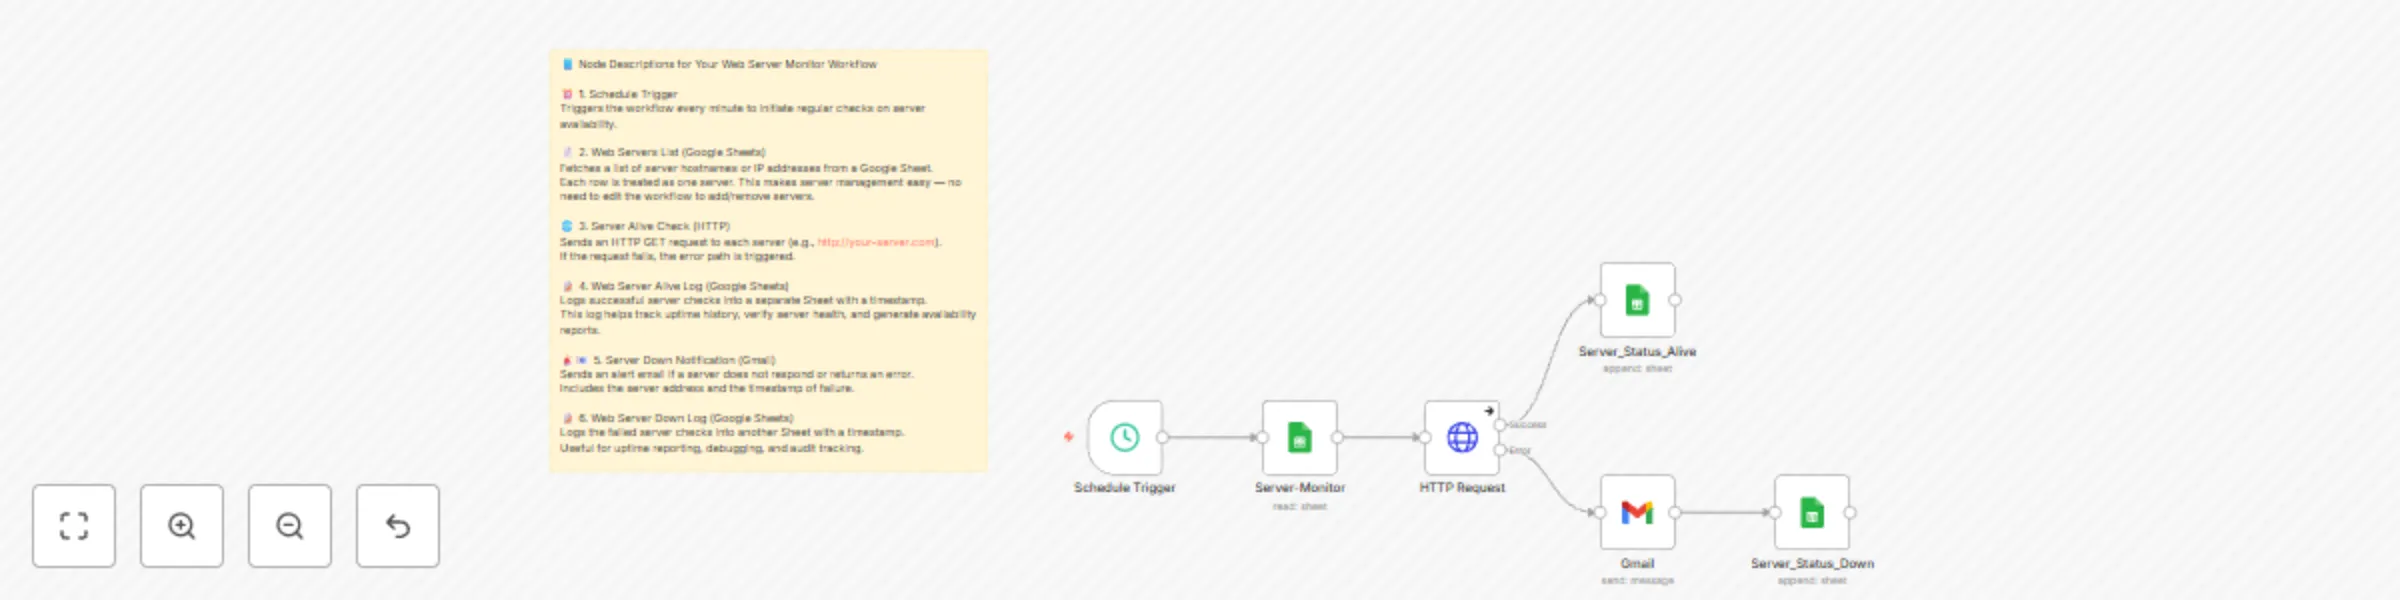
Workflow preview


 Early Deal
DISCOUNT 20%

Important notice
This workflow is provided as-is. Please review and test before using in production.
Overview
🌐 Web Server Monitor & Alert System
This automation pings web servers at regular intervals, logs their status, and sends email alerts if a server goes down. It’s perfect for maintaining visibility over server uptime — without complex monitoring tools. 🧠 How It Works
This workflow performs minute-by-minute checks on all listed servers in a Google Sheet and:
✅ Logs all reachable servers in an “Alive” log.

🔻 Sends an email alert if a server is unreachable.

📄 Logs failed servers in a “Down” sheet with timestamps.
🧩 Key Components ⏰ 1. Schedule Trigger
Runs the workflow every minute for real-time monitoring. 📄 2. Web Servers List (Google Sheets)
Pulls server IPs or hostnames from a Google Sheet named Server_List. Each row = one server to monitor. This makes adding/removing servers effortless — just update the sheet. 🌐 3. Servers Alive Check (HTTP Request)
Performs an HTTP GET request to each server (e.g., http://your-server.com). If the request fails, it automatically triggers the error path (handled via continueOnFail). ✅ 4. Web Server Alive Log (Google Sheets)
Records successful pings in Server_Status_Alive with:
Timestamp

Server IP

Status = Alive
This log can be used for uptime reports or audits. 📧 5. Server Down Notification (Gmail)
If a server fails, this node sends an email to the admin. It includes:
Server address

Timestamp

Suggested action
📄 6. Web Server Down Log (Google Sheets)
Logs failed pings in a separate sheet for historical tracking and debugging. ✅ Main Advantages
Live Server Monitoring
Stay informed about server health in near real-time.

No-Code Configuration
Add/remove servers from the Google Sheet — no need to touch the workflow.

Email Alerts on Failure
Proactively notifies you before users report the issue.

Audit-Ready Logging
Maintains logs for both healthy and failed checks for documentation or reporting.

Flexible & Scalable
Monitor 1 or 100 servers with the same template — just scale the list.
⚙️ Setup Steps 🔑 Prerequisites
Google Sheet with server list (column name = “Server”)

Gmail OAuth2 Connection for alerts

n8n Instance running regularly
🛠 Configuration
Google Sheets

    Sheet 1 (Server_List): Your list of servers.

    Sheet 2 (Server_Status_Alive): Log for reachable servers.

    Sheet 3 (Server_Status_Down): Log for unreachable servers.

Gmail Integration

    Connect your Gmail account in the Server Down Notification node.

    Edit recipient email and message content as needed.

HTTP Check

    Adjust the HTTP request URL template if using port numbers or paths (e.g., http://{{Server}}:8080/status).

Schedule

    Default is every 1 minute. Change via Schedule Trigger if needed.
🧪 Testing
Input a reachable server (e.g., example.com) and an unreachable IP.

Run the workflow manually or wait for the next scheduled run.

Check:

    Alive log updates correctly.

    Down log records failures.

    Email alert is received.
🚀 Deployment
Activate the workflow, and it will quietly run in the background, notifying you of any server downtime instantly while keeping logs for future review.