Generate a weekly business health report from Google Sheets with Claude
Workflow preview
$20/month : Unlimited workflows
2500 executions/month
THE #1 IN WEB SCRAPING
Scrape any website without limits
HOSTINGER  Early Deal
DISCOUNT 20% Try free
DISCOUNT 20%
Self-hosted n8n
Unlimited workflows - from $4.99/mo
#1 hub for scraping, AI & automation
6000+ actors - $5 credits/mo
Overview
Overview
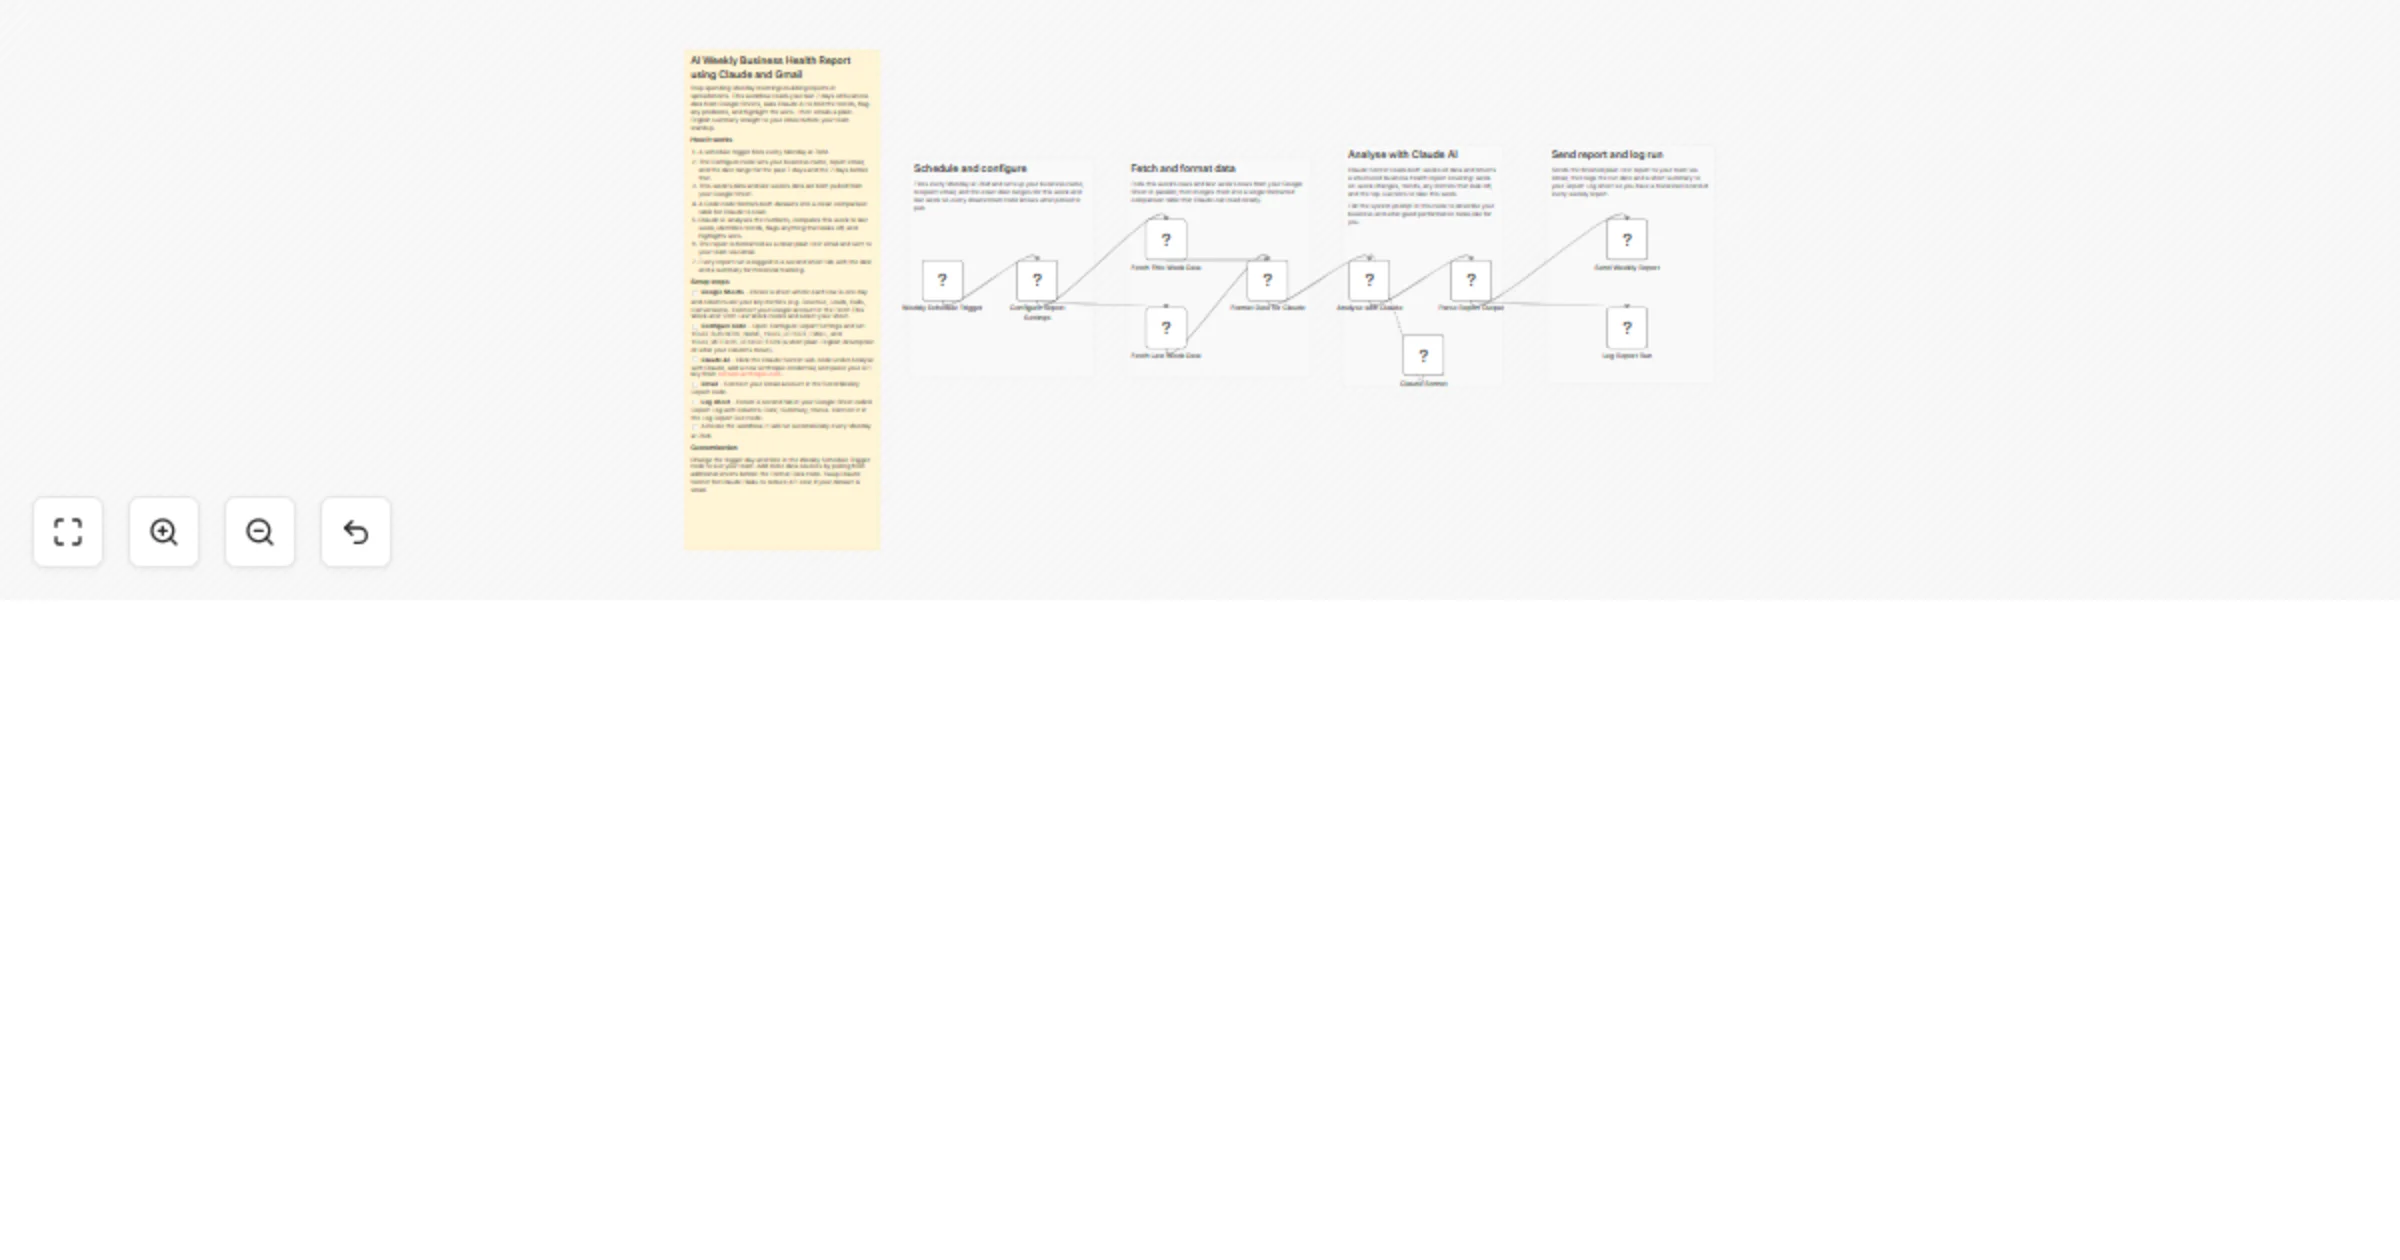
Stop spending Monday mornings manually pulling numbers and building reports. This workflow reads your last 7 days of business data from Google Sheets, asks Claude AI to compare it to the week before, spot trends, flag problems and highlight wins — then emails a plain-English health report to your inbox before your team standup.
How it works
- Fires every Monday at 7AM automatically
- Pulls this week's and last week's data from your Google Sheet
- Formats both datasets into a clean comparison table
- Claude AI analyses the numbers and writes a structured health report covering wins, concerns, and top 3 actions
- Report is emailed to your team via Gmail
- Every run is logged to a second sheet tab for historical tracking
Setup steps
- Google Sheets — Connect your Google account in Fetch This Week Data and Fetch Last Week Data nodes and select your data sheet. Each row should be one day, columns should be your key metrics
- Configure node — Open Configure Report Settings and set your business name, report email, and a plain-English description of what your columns mean
- Claude AI — Add your Anthropic API key to the Claude Sonnet sub-node from console.anthropic.com
- Gmail — Connect your Gmail account in Send Weekly Report
- Log sheet — Create a second tab called Report Log with columns: Date, Week Covered, Business, Status, Summary. Connect it in Log Report Run
- Activate — runs automatically every Monday at 7AM