Analyze logs and correlate incidents with OpenAI and Slack

Workflow preview
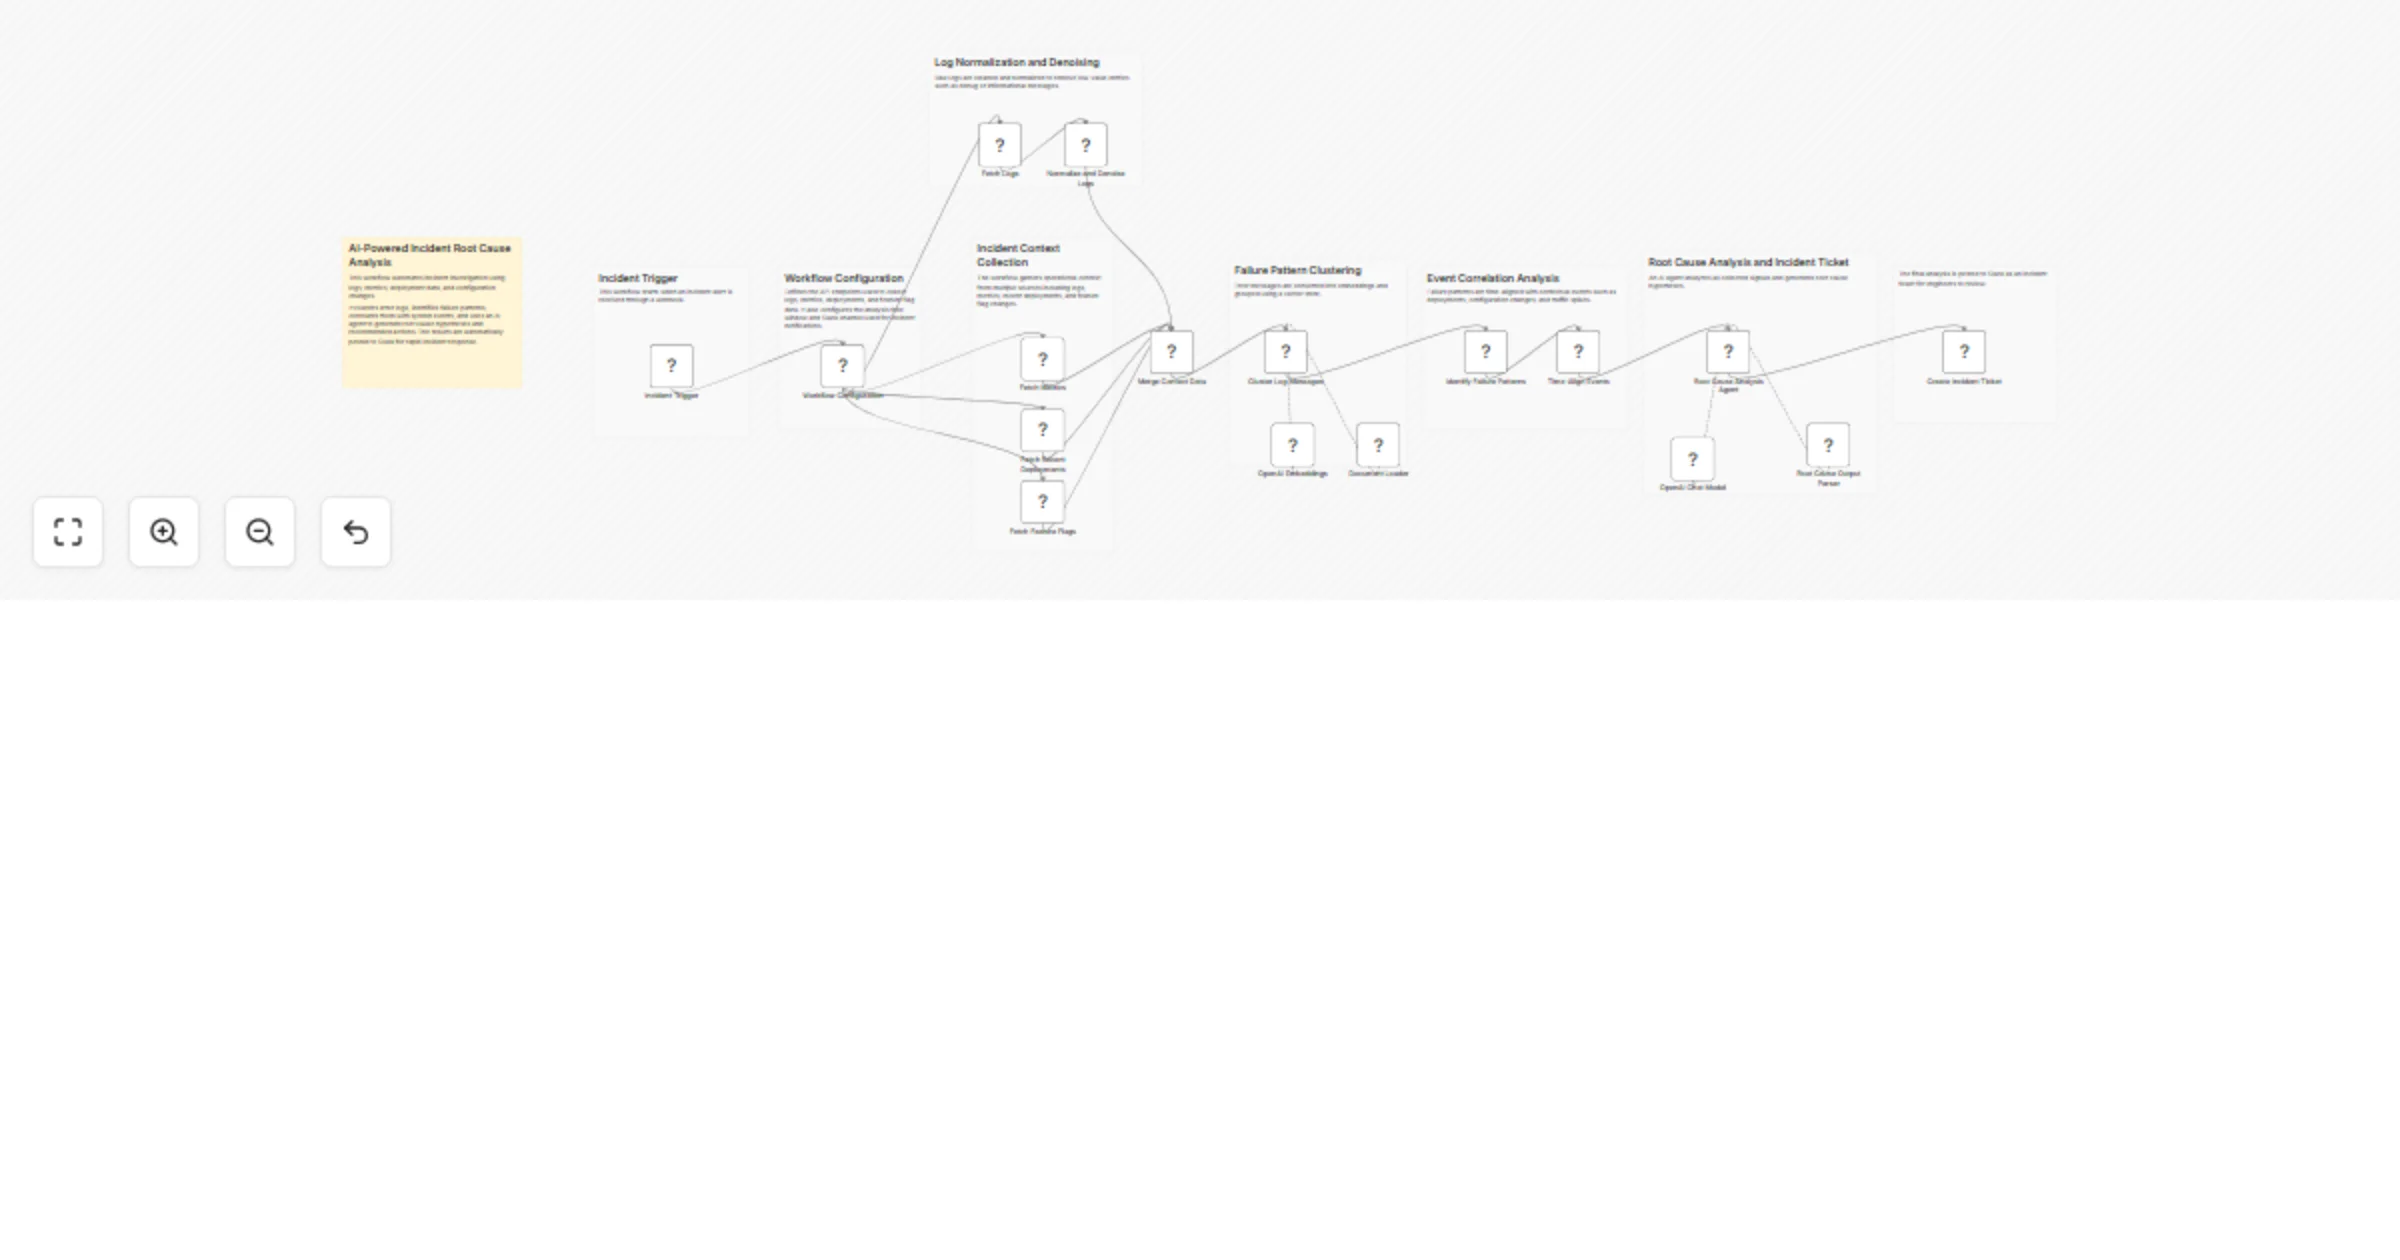
Workflow preview
100%
Analyze logs and correlate incidents with OpenAI and Slack preview
Open on n8n.io

1. Workflow Overview

Overview This workflow implements an AI powered incident investigation and root cause analysis system that automatically analyzes operational signals when a system incident occurs. When an incident...

Best for

  • DevOps automation workflows
  • AI RAG automation workflows
  • advanced n8n builders looking for reusable templates

Tools used

n8n-nodes-base.webhook, n8n-nodes-base.set, n8n-nodes-base.httprequest, n8n-nodes-base.code, n8n-nodes-base.aggregate, @n8n/n8n-nodes-langchain.embeddingsopenai, @n8n/n8n-nodes-langchain.vectorstoreinmemory, @n8n/n8n-nodes-langchain.lmchatopenai

Source and attribution

This workflow is cataloged by N8N Workflows and links back to its original n8n.io source page by ResilNext.

Original n8n.io source

1.1 Workflow description

Title
Analyze logs and correlate incidents with OpenAI and Slack
Workflow name
Analyze logs and correlate incidents with OpenAI and Slack

Overview

This workflow implements an AI-powered incident investigation and root cause analysis system that automatically analyzes operational signals when a system incident occurs.

When an incident is triggered via webhook, the workflow gathers operational context including application logs, system metrics, recent deployments, and feature flag changes. These signals are processed to detect error patterns, cluster similar failures, and correlate them with recent system changes.

The workflow uses vector embeddings to group similar log messages, allowing it to detect dominant failure patterns across services. It then aligns these failures with contextual events such as deployments, configuration changes, or traffic spikes to identify potential causal relationships.

An AI agent analyzes all available evidence and generates structured root cause hypotheses, including confidence scores, supporting evidence, and recommended remediation actions.

Finally, the workflow posts a detailed incident report directly to Slack, enabling engineering teams to quickly understand the issue and respond faster.

This architecture helps teams reduce mean time to resolution (MTTR) by automating the early stages of incident investigation.


How It Works

1. Incident Trigger

The workflow begins when an incident alert is received through a webhook endpoint. The webhook payload may include information such as:

  • incident ID
  • severity level
  • timestamp
  • affected service

This event starts the automated investigation process.


2. Workflow Configuration

A configuration node defines the operational parameters used throughout the workflow, including:

  • Logs API endpoint
  • Metrics API endpoint
  • Deployments API endpoint
  • Feature flags API endpoint
  • Time window for analysis
  • Slack channel for incident notifications

This allows the workflow to be easily adapted to different observability stacks.


3. Incident Context Collection

The workflow collects system context from multiple sources:

  • application logs
  • infrastructure or service metrics
  • recent deployments
  • active feature flags

Gathering this information provides the signals required to understand what happened before and during the incident.


4. Log Normalization and Denoising

Raw logs are processed to remove low-value entries such as debug or informational messages.

The workflow extracts structured error information including:

  • timestamps
  • log severity
  • services involved
  • request or session IDs
  • error messages and stack traces

This step ensures that only relevant failure signals are analyzed.


5. Failure Pattern Clustering

Error messages are converted into embeddings using OpenAI.

The workflow stores these embeddings in an in-memory vector store to group similar log messages together. This clustering step identifies dominant failure patterns that may appear across multiple sessions or services.


6. Failure Pattern Analysis

Clustered log data is analyzed to detect recurring error types and dominant failure clusters.

The workflow calculates statistics such as:

  • total error volume
  • most common error types
  • error distribution across clusters
  • dominant failure patterns

These insights help highlight the primary issues affecting the system.


7. Event Correlation Analysis

Failure patterns are then aligned with contextual events such as:

  • deployments
  • configuration changes
  • traffic spikes

The workflow calculates correlation scores based on temporal proximity and assigns likelihood scores to potential causes.

This allows the system to identify events that may have triggered the incident.


8. AI Root Cause Analysis

An AI agent analyzes the collected signals and generates structured root cause hypotheses.

The agent considers:

  • error clusters
  • deployment timing
  • configuration changes
  • traffic patterns
  • system metrics

The output includes:

  • multiple root cause hypotheses
  • confidence scores
  • supporting evidence
  • recommended remediation actions

9. Incident Ticket Creation

The final analysis is formatted into a structured incident report and posted to Slack.

The Slack message contains:

  • incident metadata
  • root cause hypotheses
  • confidence scores
  • evidence
  • recommended actions
  • affected services

This enables engineers to quickly review the investigation results and take action.


Setup Instructions

1. Configure Observability APIs

Update the Workflow Configuration node with API endpoints for:

  • Logs API
  • Metrics API
  • Deployments API
  • Feature Flags API

These APIs should return JSON responses containing recent operational data.


2. Configure OpenAI Credentials

Add OpenAI credentials for:

  • OpenAI Embeddings
  • OpenAI Chat Model

These are used for log clustering and root cause analysis.


3. Configure Slack Integration

Add Slack credentials and specify the Slack channel ID in the configuration node.

Incident reports will be posted automatically to this channel.


4. Configure the Incident Trigger

Deploy the webhook endpoint generated by the Incident Trigger node.

Your monitoring or alerting system (PagerDuty, Grafana, Datadog, etc.) can call this webhook when incidents occur.


5. Activate the Workflow

Once configured, activate the workflow in n8n.

When incidents are triggered, the workflow will automatically run the investigation pipeline and generate a Slack incident report.


Use Cases

Automated Incident Investigation

Automatically analyze operational signals when alerts are triggered to identify possible causes.


AI-Assisted Site Reliability Engineering

Provide engineers with AI-generated root cause hypotheses and investigation insights.


Deployment Impact Detection

Detect whether a recent deployment or configuration change caused a system failure.


Observability Signal Correlation

Combine logs, metrics, and system events to produce a unified incident analysis.


Faster Incident Response

Reduce mean time to resolution (MTTR) by automating the early stages of incident debugging.


Requirements

  • n8n with LangChain nodes enabled
  • OpenAI API credentials
  • Slack credentials
  • APIs for retrieving:
  • system logs
  • service metrics
  • deployment history
  • feature flag status

1.2 Logical Blocks

This catalog entry is organized from the workflow JSON. The node-level section below shows the executable blocks available for review before importing the template.

2. Block-by-Block Analysis

Block 1 - Incident Trigger

Type / Role
n8n-nodes-base.webhook - webhook
Config choices
Version 2.1

Block 2 - Workflow Configuration

Type / Role
n8n-nodes-base.set - set
Config choices
Version 3.4

Block 3 - Fetch Logs

Type / Role
n8n-nodes-base.httpRequest - httpRequest
Config choices
Version 4.3

Block 4 - Fetch Metrics

Type / Role
n8n-nodes-base.httpRequest - httpRequest
Config choices
Version 4.3

Block 5 - Fetch Recent Deployments

Type / Role
n8n-nodes-base.httpRequest - httpRequest
Config choices
Version 4.3

Block 6 - Fetch Feature Flags

Type / Role
n8n-nodes-base.httpRequest - httpRequest
Config choices
Version 4.3

Block 7 - Normalize and Denoise Logs

Type / Role
n8n-nodes-base.code - code
Config choices
Version 2

Block 8 - Merge Context Data

Type / Role
n8n-nodes-base.aggregate - aggregate
Config choices
Version 1

Block 9 - OpenAI Embeddings

Type / Role
@n8n/n8n-nodes-langchain.embeddingsOpenAi - embeddingsOpenAi
Config choices
Version 1.2

Block 10 - Cluster Log Messages

Type / Role
@n8n/n8n-nodes-langchain.vectorStoreInMemory - vectorStoreInMemory
Config choices
Version 1.3

Block 11 - Identify Failure Patterns

Type / Role
n8n-nodes-base.code - code
Config choices
Version 2

Block 12 - Time-Align Events

Type / Role
n8n-nodes-base.code - code
Config choices
Version 2

Block 13 - OpenAI Chat Model

Type / Role
@n8n/n8n-nodes-langchain.lmChatOpenAi - lmChatOpenAi
Config choices
Version 1.3

Block 14 - Root Cause Output Parser

Type / Role
@n8n/n8n-nodes-langchain.outputParserStructured - outputParserStructured
Config choices
Version 1.3

Block 15 - Root Cause Analysis Agent

Type / Role
@n8n/n8n-nodes-langchain.agent - agent
Config choices
Version 3

Block 16 - Create Incident Ticket

Type / Role
n8n-nodes-base.slack - slack
Config choices
Version 2.4

Block 17 - Document Loader

Type / Role
@n8n/n8n-nodes-langchain.documentDefaultDataLoader - documentDefaultDataLoader
Config choices
Version 1.1

Block 18 - Sticky Note

Type / Role
n8n-nodes-base.stickyNote - stickyNote
Config choices
Version 1

Block 19 - Sticky Note1

Type / Role
n8n-nodes-base.stickyNote - stickyNote
Config choices
Version 1

Block 20 - Sticky Note2

Type / Role
n8n-nodes-base.stickyNote - stickyNote
Config choices
Version 1

Block 21 - Sticky Note3

Type / Role
n8n-nodes-base.stickyNote - stickyNote
Config choices
Version 1

Block 22 - Sticky Note4

Type / Role
n8n-nodes-base.stickyNote - stickyNote
Config choices
Version 1

Block 23 - Sticky Note5

Type / Role
n8n-nodes-base.stickyNote - stickyNote
Config choices
Version 1

Block 24 - Sticky Note6

Type / Role
n8n-nodes-base.stickyNote - stickyNote
Config choices
Version 1

Showing the first 24 of 26 workflow blocks. Download the JSON for the full node graph.

3. Summary Table

Workflow Analyze logs and correlate incidents with OpenAI and Slack
Complexity advanced
Nodes 26
Categories DevOps, AI RAG
Author ResilNext
Published 14 Mar 2026

4. Reproducing the Workflow from Scratch

  1. 1. Download the workflow JSON

    Use the JSON export at /data/workflows/14044/14044.json as the source template for this automation.

  2. 2. Import the template into n8n

    Open n8n, import the downloaded JSON, and review each node before activating the workflow.

  3. 3. Configure credentials and variables

    Replace placeholder credentials, API keys, webhook URLs, account IDs, and environment-specific values with your own settings.

  4. 4. Test with sample data

    Run the workflow manually or in a staging workspace, inspect node output, and confirm downstream systems receive the expected data.

  5. 5. Activate and monitor

    Enable the workflow only after testing, then monitor executions, errors, and rate limits during the first production runs.

5. General Notes & Resources

Review imported nodes carefully before activation. This catalog entry is intended to help you inspect the workflow structure, understand required services, and find related templates faster.

Node names, credentials, schedules, webhook paths, and external service limits may need adjustment for your workspace.

Frequently asked questions

What does Analyze logs and correlate incidents with OpenAI and Slack do?

Overview This workflow implements an AI powered incident investigation and root cause analysis system that automatically analyzes operational signals when a system incident occurs. When an incident...

What do I need before importing this workflow?

Review the workflow JSON, configure any required credentials in n8n, and test the automation in a safe workspace before using it in production.

Can I customize this workflow?

Yes. Use the block-by-block analysis and the downloadable JSON to inspect each node, then adjust credentials, prompts, schedules, filters, or destinations for your DevOps, AI RAG use case.