Transform spreadsheet data into smart charts with OpenAI, QuickChart & Google Drive
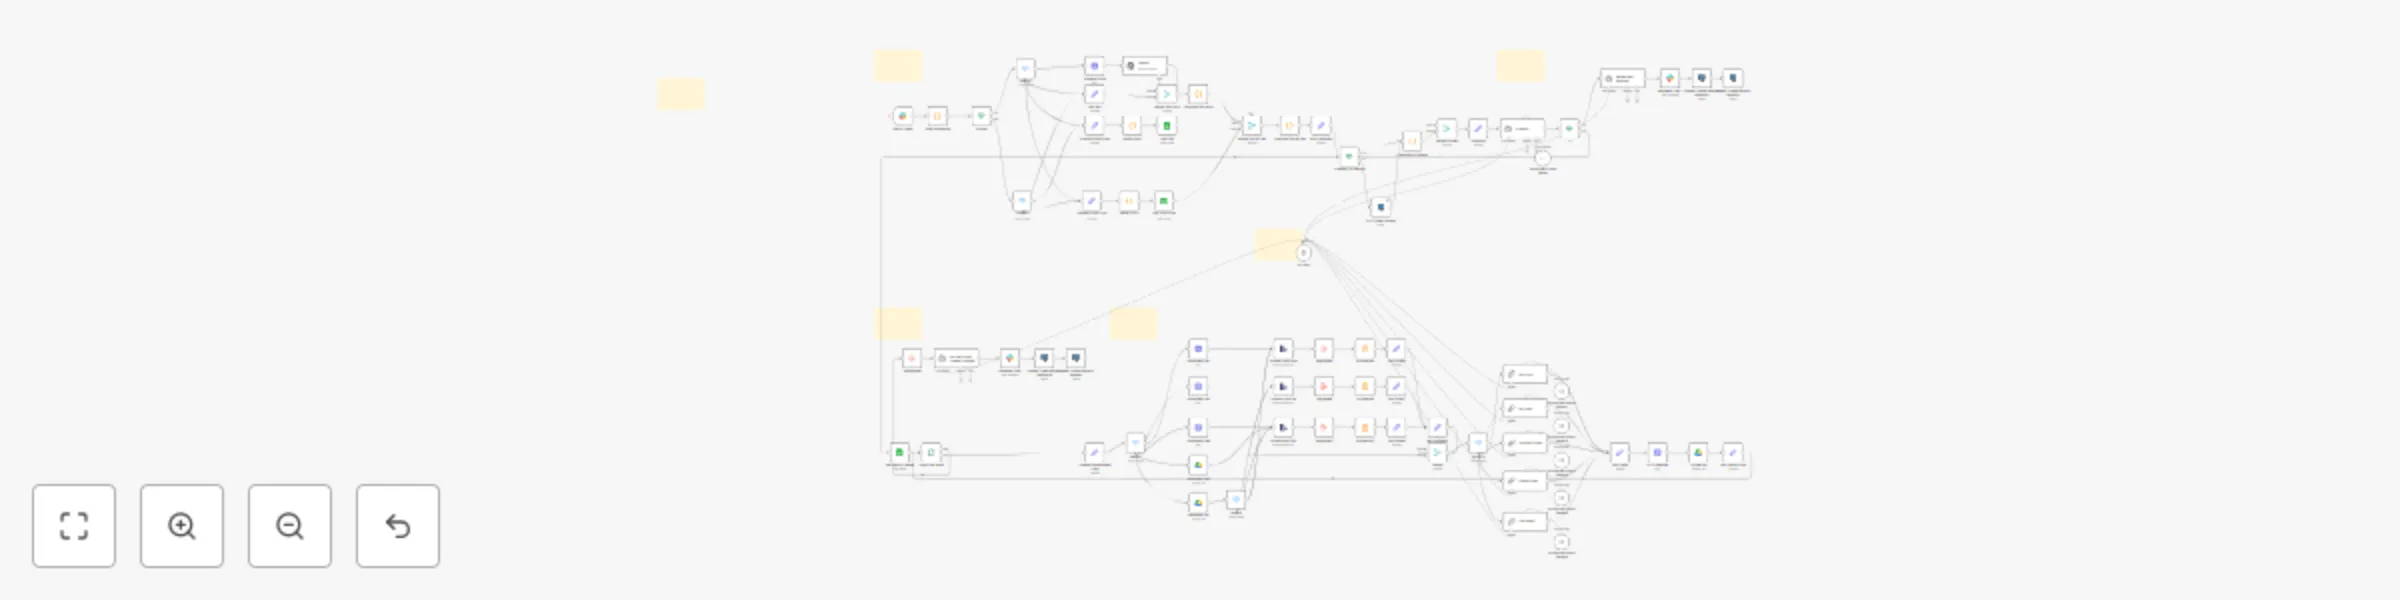
Workflow preview


 Early Deal
DISCOUNT 20%

Important notice
This workflow is provided as-is. Please review and test before using in production.
Overview
Overview of the n8n Workflow
This n8n workflow automates the transformation of spreadsheet data into professional charts and graphs using AI-driven analysis. Triggered via Slack, it processes uploaded files (Excel, CSV, Google Sheets, or Drive links), interprets the data with an AI agent to determine the best visualization type (e.g., bar, line, pie, doughnut, or bubble charts), generates images via QuickChart, uploads them to Google Drive, and delivers the results back to the user in Slack with titles and shareable links. It maintains conversation context in Postgres for seamless multi-turn interactions and handles audio or text inputs for chart requests.
What this workflow does:
- Hooks up to Slack for seamless spreadsheet uploads
- Automatically extracts your data and generates bar charts, line graphs, bubble charts, and more
- Delivers stunning visualizations straight back to you in Slack
- Makes it easy to spot trends, patterns, and insights—on demand
How it Works
• Users upload spreadsheets or share links via Slack, along with a natural language request (e.g., "Create a bar chart of sales by month"). • The workflow detects file types, extracts and aggregates data, then uses an AI agent to parse the request and select an appropriate chart type.
• Data is formatted and sent to QuickChart's API to generate the visualization image.
• Images are uploaded to Google Drive, and a confirmation message with titles and links is sent back to Slack.
Set Up Steps
Setup takes about 15-30 minutes, mainly for credential configuration. Detailed node instructions are in the workflow's sticky notes—focus on pasting API keys and testing triggers. Once cloned, the workflow runs plug-and-play; only tweak credentials and optional prompts as needed.
⚙️ Turn Spreadsheets Into Charts & Graphics
Automate turning uploaded spreadsheets into AI-generated charts (bar, line, pie, etc.) via Slack, with results shared as Google Drive links.
🧑💻 Author: LeeWei
🚀 Steps to Connect:
Slack Bot Setup
- Create a Slack app at api.slack.com/apps and add scopes for
chat:write,files:read,channels:read. - Generate a Bot User OAuth Token and paste it into the
Slack Triggernode's credentials in n8n. - Invite the bot to your desired channel for file uploads and messages.
- Create a Slack app at api.slack.com/apps and add scopes for
OpenAI API Key
- Sign up at platform.openai.com and generate an API key.
- Paste this key into the
OpenAI(gpt-4o-mini) node's credentials. - 💡 For cost efficiency, monitor usage—basic charts use minimal tokens.
Postgres Database Connection
- Set up a Postgres instance (e.g., via Supabase or your host) with a table named
n8n_rodger_chatfor chat history. - Add connection details (host, database, user, password) to the
Postgresnodes' credentials. - This enables thread memory; skip if not using multi-turn chats (but recommended for context).
- Set up a Postgres instance (e.g., via Supabase or your host) with a table named
Google Sheets & Drive Setup
- Create OAuth2 credentials at console.cloud.google.com with scopes for Sheets (read) and Drive (upload, share).
- Paste the credentials into the
Google Sheetsand implied Drive upload nodes. - Test by sharing a sample sheet—ensures data extraction and image storage work.
QuickChart Integration
- No API key needed for free tier (up to 500 charts/month); visit quickchart.io to confirm.
- For production (100k+ charts/month), upgrade to corporate plan ($40/month) and add any auth if required in the
HTTP Requestnode. - The node is pre-configured for chart generation—edit URL params only for custom styling.
Plug and Play Instructions
Clone the workflow JSON directly into n8n—all nodes (triggers, AI agents, extractors, switches) are pre-wired and ready. No re-setup needed beyond the steps above. Key editable fields (found in sticky notes):
AI Agent Node: System Prompt
Customize the chart interpretation (default: auto-selects bar/line/pie/etc. based on data). Example: Change to prioritize "scatter plots for correlations" if needed.Switch Nodes (File Detection)
Add rules for new formats (e.g.,.odsfor OpenDocument) in the conditions for XLS/XLSX/CSV/Sheets/Drive.HTTP Request Node (QuickChart)
Tweak chart params likewidth=800&height=600for size, or colors via?chart=...for branding.Let User Know Upload Complete: Text
Adjust the confirmation message template for tone (e.g., add emojis or custom phrasing).
Test with a sample Slack message: "Make a line graph from this sales CSV over months." Results appear instantly with links.
Potential Customizations
- Add Chart Types: Duplicate a chart branch (e.g., Line Graph) and integrate new QuickChart endpoints for scatter or funnel charts.
- Switch AI Provider: Replace OpenAI with OpenRouter in the Chat Model node for alternative LLMs.
- Batch Size: Edit the Loop Over Items node's batch for larger datasets (default handles small files efficiently).
- Error Handling: Add IF nodes post-extraction to notify on invalid data.
Considerations and Improvements
- Rate Limits: QuickChart free tier suits testing; scale to paid for heavy use. OpenAI tokens add up for complex data.
- File Limits: Supports up to ~10MB uploads; for larger, preprocess externally.
- Privacy: Data passes through OpenAI—review for sensitive info.
- Enhancements: Integrate image OCR for scanned tables, or export to PDF for reports.
This workflow streamlines data viz without coding, perfect for teams analyzing trends on the fly. Questions? Drop a Slack message in your bot channel!