Track Azure API and Service Bus failures with Application Insights correlation
Workflow preview


 Early Deal
DISCOUNT 20%

Overview
Track Azure API failures with Application Insights correlation
Template Name
Track Azure API failures with App Insights, APIM, and Service Bus correlation
Description
Troubleshoot failed API calls by correlating Application Insights telemetry with API Management logs and Service Bus messages. Query failures from the last 24 hours to 30 days, identify root causes, and generate detailed failure reports with full context.
Who's it for
DevOps Engineers, Site Reliability Engineers, API developers, Support teams, and Platform engineers troubleshooting production incidents.
How it works
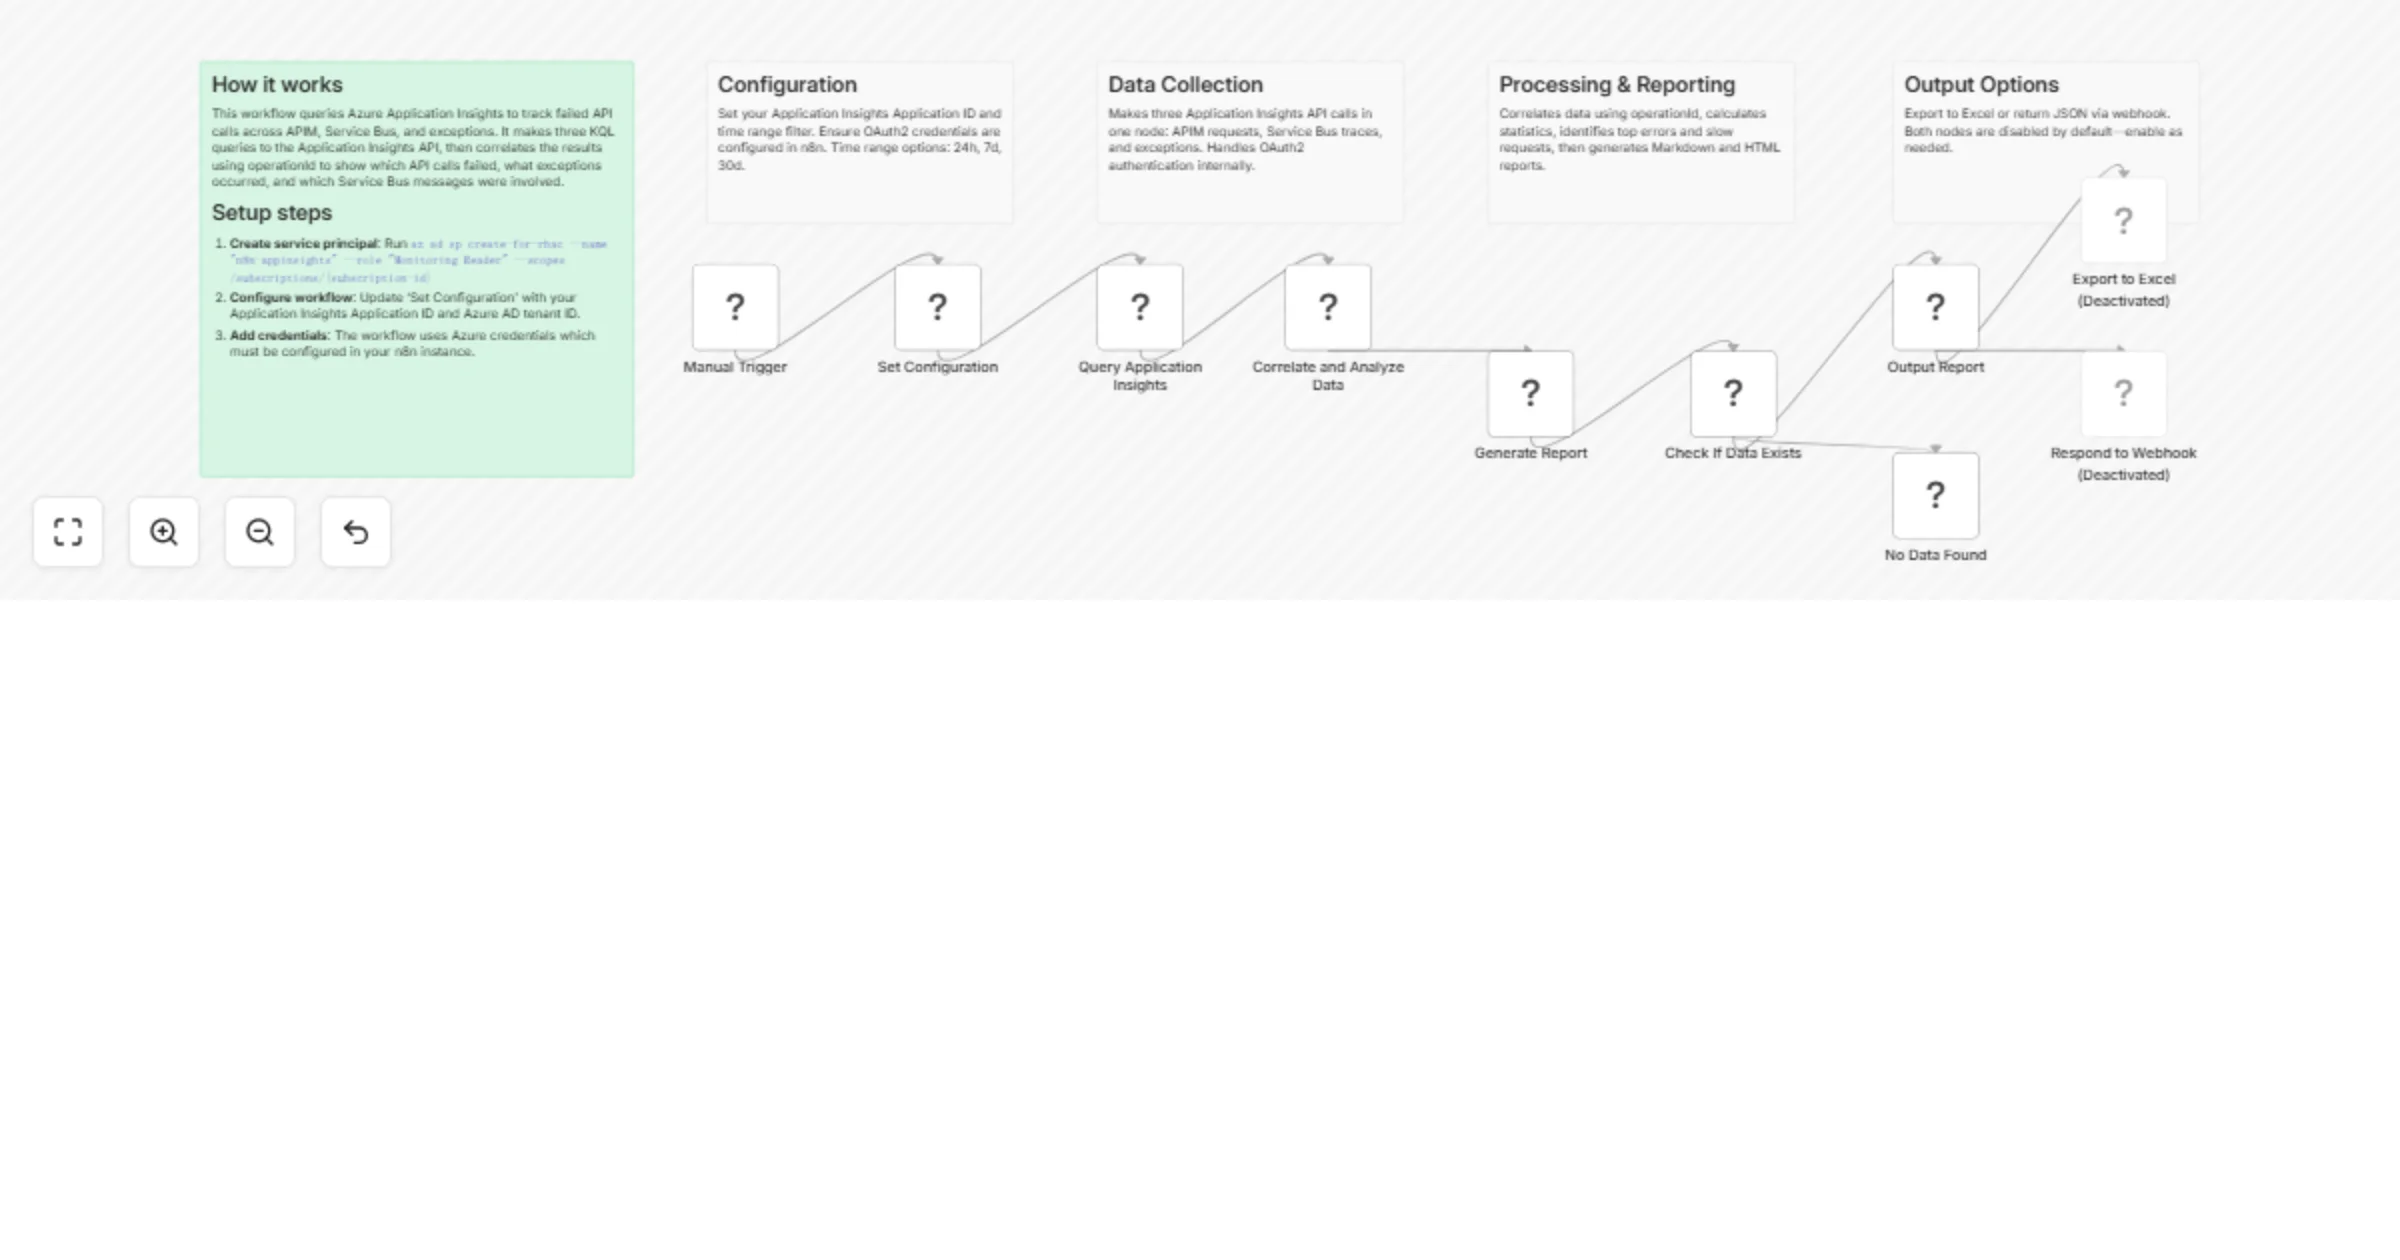
- Set Configuration: Stores credentials and query parameters
- Query Application Insights: Single node retrieves APIM requests, Service Bus traces, and exceptions via OAuth2
- Correlate and Analyze Data: Links requests to SB messages and exceptions via operation IDs
- Generate Report: Creates detailed failure analysis with root cause data
- Output: Markdown/HTML reports, Excel export, or JSON API response
Set up steps
Prerequisites
- Application Insights resource in Azure
- APIM and Service Bus logging to App Insights
- Service Principal with "Monitoring Reader" role
Setup
1. Create Azure Service Principal
Azure CLI:
# Create service principal
az ad sp create-for-rbac --name "n8n-appinsights-tracker" \
 --role "Monitoring Reader" \
 --scopes /subscriptions/{subscription-id}/resourceGroups/{resource-group}/providers/Microsoft.Insights/components/{app-insights-name}
Save the output:
appId(client ID)password(client secret)tenant(tenant ID)
Also get your Application Insights App ID:
az monitor app-insights component show --app {name} -g {rg} --query appId -o tsv
2. Configure Workflow
Open "Set Configuration" node and update:
appId- Application Insights Application IDclientId- Service Principal client ID (from step 1)clientSecret- Service Principal password (from step 1)tenantId- Azure AD tenant ID (from step 1)timeRange- 24h, 7d, or 30dincludeSuccessful- false (failures only) or true (all requests)
3. Verify Dependencies
Ensure diagnostic logging is configured:
- APIM: Diagnostics → Application Insights enabled
- Service Bus: Diagnostic settings → Send to App Insights
- Custom Dimensions: Capture MessageId, EntityName for Service Bus
4. Test Workflow
- Click Manual Trigger
- Review "Generate Report" node output
- Verify correlated data appears
5. Enable Output Options (Optional)
- Excel: Enable "Export to Excel" for downloadable reports
- Webhook: Enable "Respond to Webhook" for API integration
Requirements
Azure Requirements
- Azure Application Insights resource
- Service Principal with "Monitoring Reader" role
- APIM and Service Bus configured to log to Application Insights
n8n Requirements
- n8n instance (cloud or self-hosted version 1.0+)
- Ability to configure credentials in Set Configuration node
How to customize
Time Range Filters
Modify timeRange in "Set Configuration":
24h- Last 24 hours (default)7d- Last 7 days30d- Last 30 days
Filter by API or Operation
Edit KQL queries in "Query Application Insights" Code node. Find the apimQuery variable and modify:
const apimQuery = `
requests
| where timestamp > ago(${timeRange})
| where name contains "specific-api-name"
| where customDimensions['apim-operation-name'] == "GetOrders"
| where resultCode >= 400
| take 500
| project timestamp, name, url, resultCode, duration, operation_Id, customDimensions
`;
Filter by Status Code
Modify the where resultCode condition:
| where resultCode == 500 // Only 500 errors
| where resultCode >= 400 and resultCode < 500 // 4xx errors
Include Custom Dimensions
Extend the project statement in any query:
| extend customField = tostring(customDimensions['YourCustomField'])
| project ..., customField
Adjust Result Limits
Change take 500 in each query to retrieve more/fewer results:
| take 1000 // Get 1000 results
Add Additional Queries
Add new queries in the Code node, for example dependency tracking:
const dependencyQuery = `
dependencies
| where timestamp > ago(${timeRange})
| where success == false
| extend operationId = tostring(operation_Id)
| take 500
| project timestamp, name, type, target, duration, success, operation_Id
`;

const dependencyResponse = await fetch(
 `https://api.applicationinsights.io/v1/apps/${appId}/query?query=${encodeURIComponent(dependencyQuery)}`,
 { headers: { 'Authorization': `Bearer ${accessToken}` } }
);
Troubleshooting
"Query failed" or 401 error: Verify Service Principal has "Monitoring Reader" role, check clientId/clientSecret/tenantId in Set Configuration node
"Token acquisition failed": Confirm credentials are correct, verify Service Principal is not expired
"No data returned": Check time range, verify APIM/SB logs to App Insights, confirm diagnostic settings enabled, ensure Application Insights App ID is correct
"Operation IDs don't correlate": Ensure custom dimensions are captured, verify telemetry initializers configured in APIM and Service Bus
"Missing Service Bus data": Enable Service Bus diagnostic logs, add MessageId to custom dimensions in logging configuration
Use Cases
Incident Response
Query last 24h of failures during incident to identify affected APIs and root causes
Pattern Analysis
Use 7d or 30d range to identify recurring error patterns and systemic issues
Performance Investigation
Sort by duration to find slow API calls and optimize bottlenecks
Customer Support
Search by operation ID from customer complaint to trace full request lifecycle
Compliance Reporting
Export to Excel for audit trail of failed transactions
Data Structure
Summary Object
{
 "totalRequests": 150,
 "failedRequests": 12,
 "successfulRequests": 138,
 "requestsWithExceptions": 8,
 "requestsWithServiceBus": 45,
 "averageDuration": 234.5,
 "timeRange": "24h"
}
Failed Request Object
{
 "timestamp": "2026-01-19T10:30:00Z",
 "apiName": "POST /api/orders",
 "url": "https://api.example.com/orders",
 "resultCode": 500,
 "duration": 1523,
 "operationId": "abc-123-def",
 "apimServiceName": "prod-apim",
 "apimOperationName": "CreateOrder",
 "serviceBusMessageIds": ["msg-456", "msg-789"],
 "exceptionMessages": ["NullReferenceException: Object not set"],
 "hasException": true,
 "isFailure": true
}
KQL Query Examples
Failed requests with exceptions
requests
| where timestamp > ago(24h)
| where resultCode >= 400
| join kind=inner (
 exceptions
 | where timestamp > ago(24h)
) on operation_Id
| project timestamp, name, resultCode, operation_Id, outerMessage
Service Bus message failures
traces
| where timestamp > ago(24h)
| where message contains "Failed to process message"
| extend messageId = tostring(customDimensions['MessageId'])
| project timestamp, message, messageId
APIM throttling analysis
requests
| where timestamp > ago(7d)
| where resultCode == 429
| summarize count() by bin(timestamp, 1h), tostring(customDimensions['apim-subscription-id'])
Integration Examples
Python - Query API
import requests

url = "https://your-n8n.com/webhook/app-insights-tracker"
response = requests.get(url)
data = response.json()

print(f"Failed Requests: {data['data']['summary']['failedRequests']}")
for error in data['data']['topErrors']:
 print(f" {error['error']}: {error['count']} times")
PowerShell - Alert on Failures
$data = Invoke-RestMethod -Uri "https://your-n8n.com/webhook/app-insights-tracker"
$failures = $data.data.summary.failedRequests

if ($failures -gt 10) {
 Send-MailMessage -To "[email protected]" `
 -Subject "ALERT: $failures API failures detected" `
 -Body $data.data.report
}
Scheduled Monitoring
Run workflow every hour with Schedule Trigger to continuously monitor for failures and alert when thresholds exceeded.
Resources
Application Insights API | KQL Reference | APIM Logging
Category: Monitoring, Observability, DevOps Difficulty: Intermediate Setup Time: 10 minutes n8n Version: 1.0+