DevOps Workflows
Automation workflows for DevOps and infrastructure management
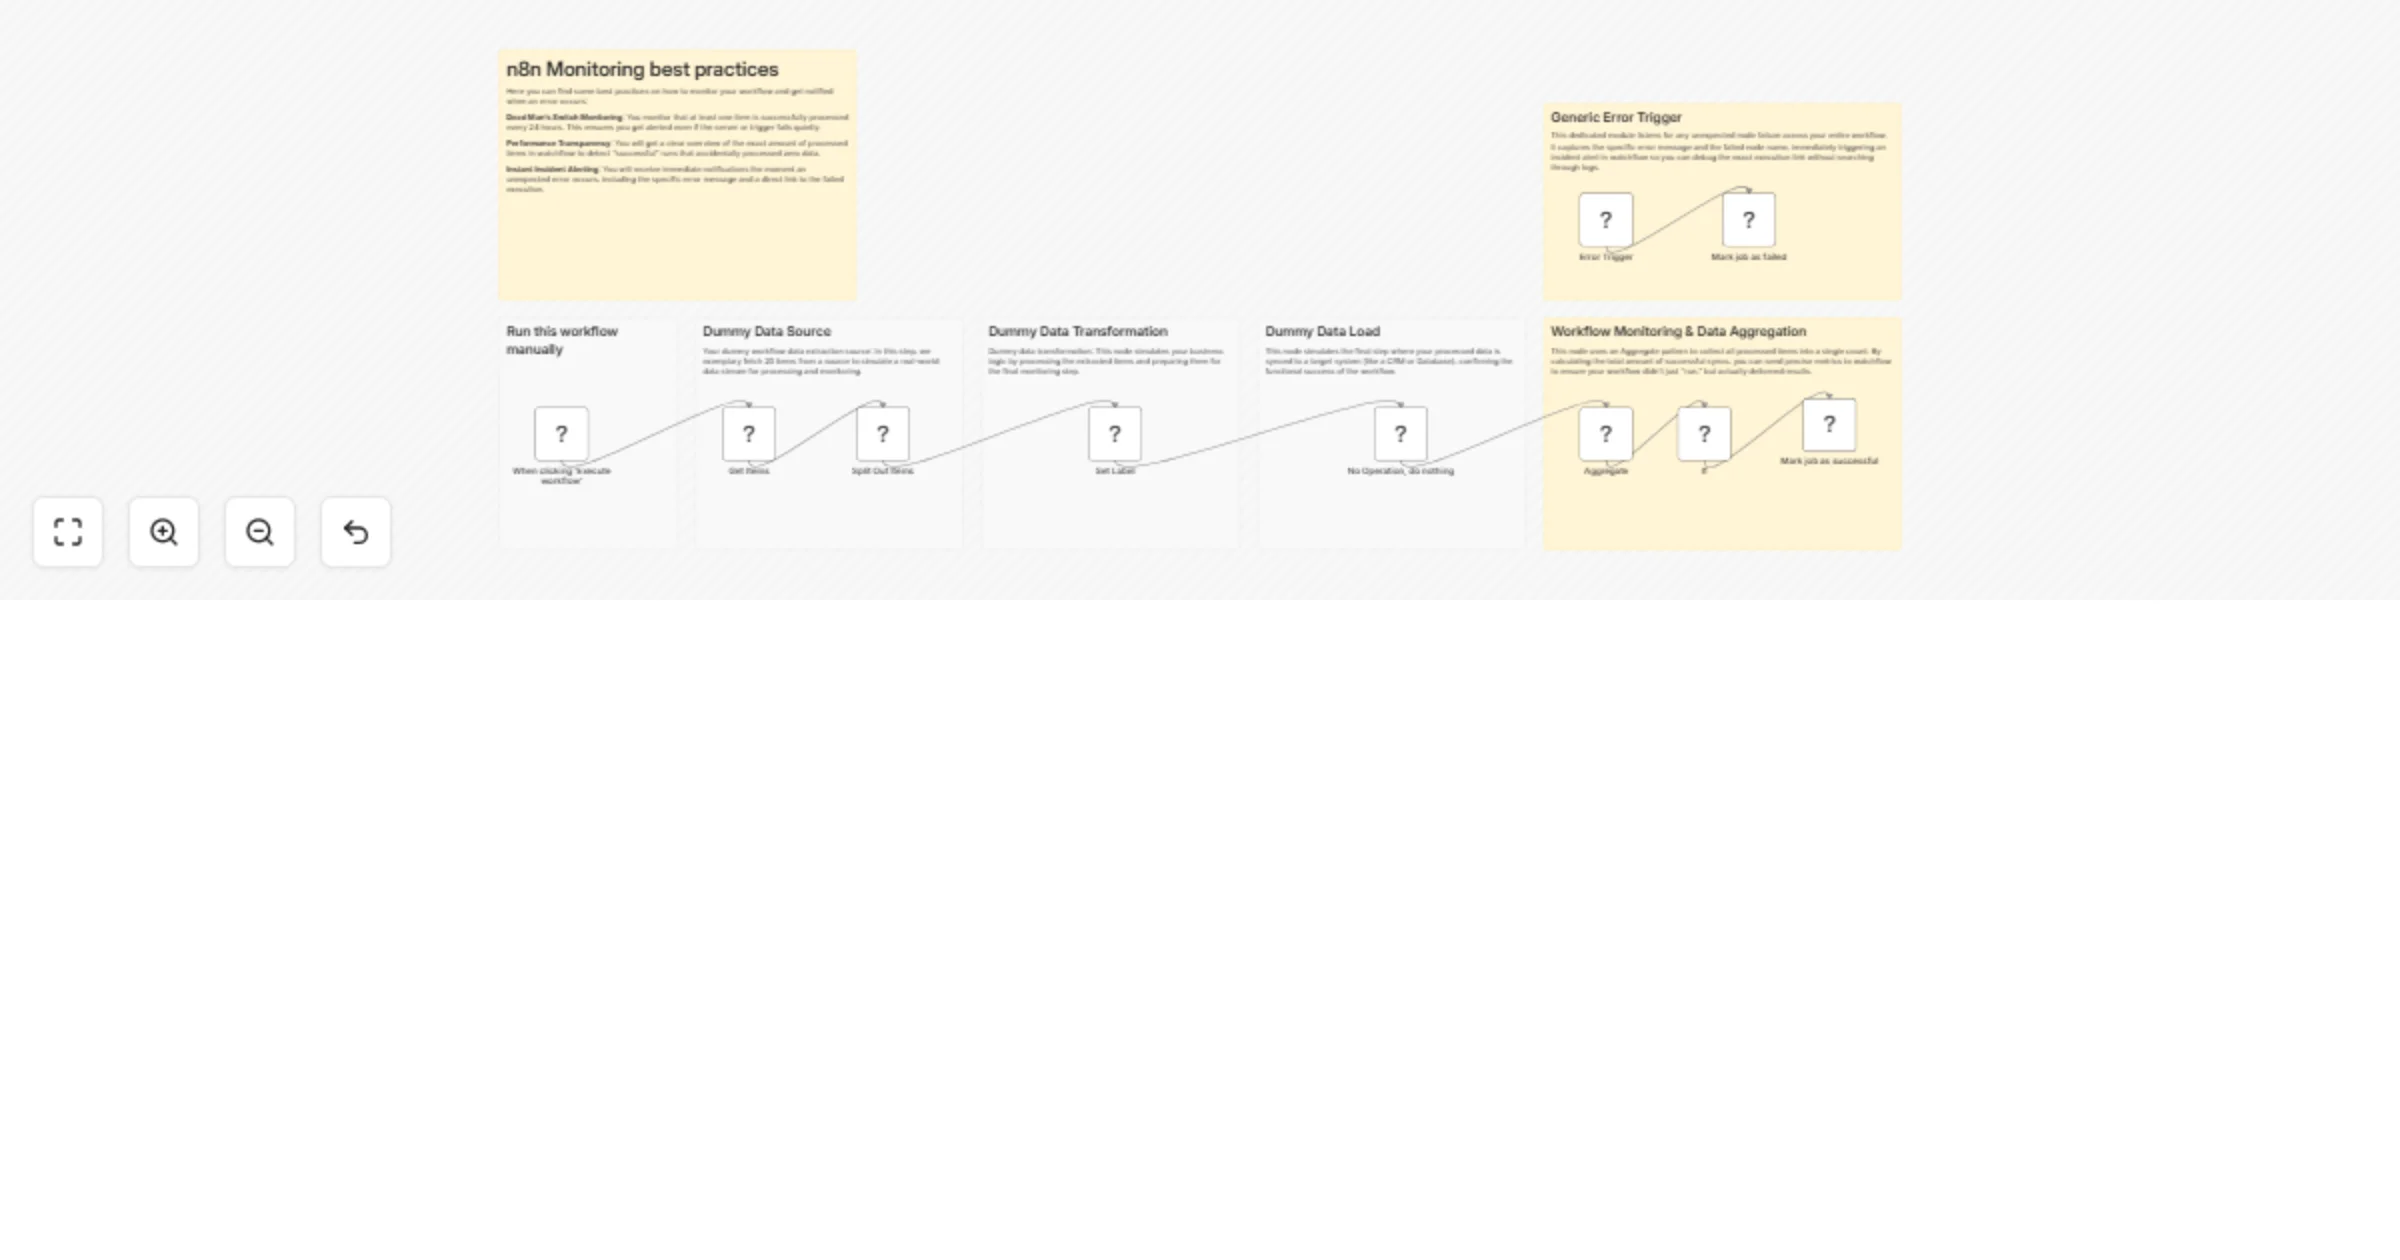
Monitor n8n workflows with Watchflow dead man’s switch and error alerts
🚀 Your n8n Workflows Monitoring Best Practices Template Are you running critical processes in n8n and relying on hop...
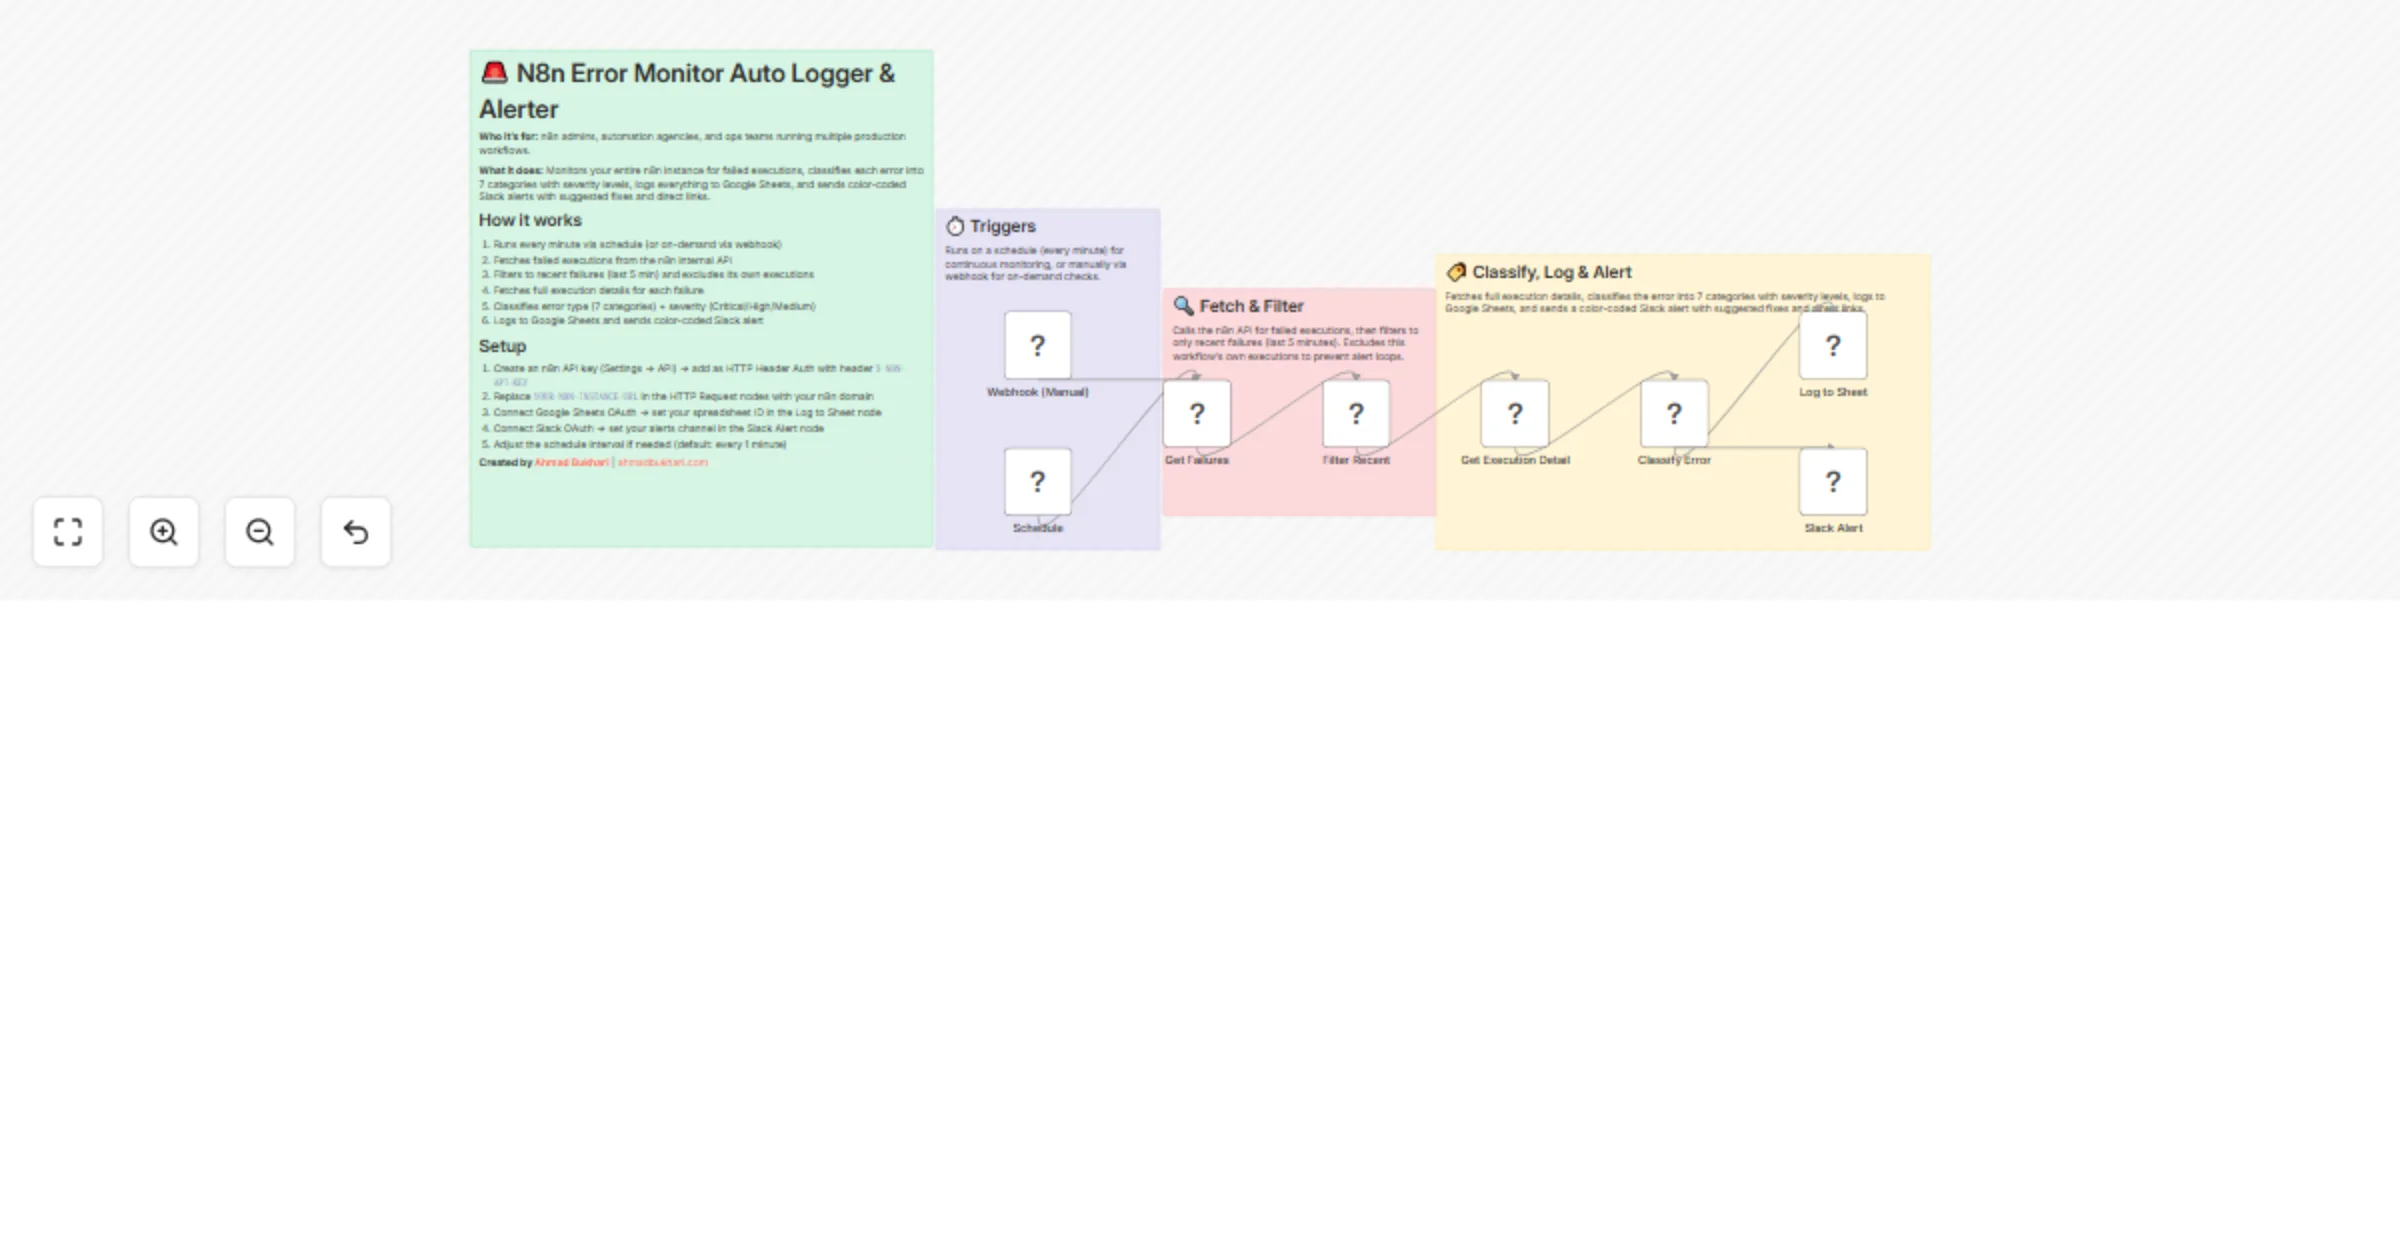
Monitor workflow errors with n8n API, log to Google Sheets, and alert via Slack
Who is this for? This workflow is built for n8n admins , automation agencies , solopreneurs , and ops teams running m...
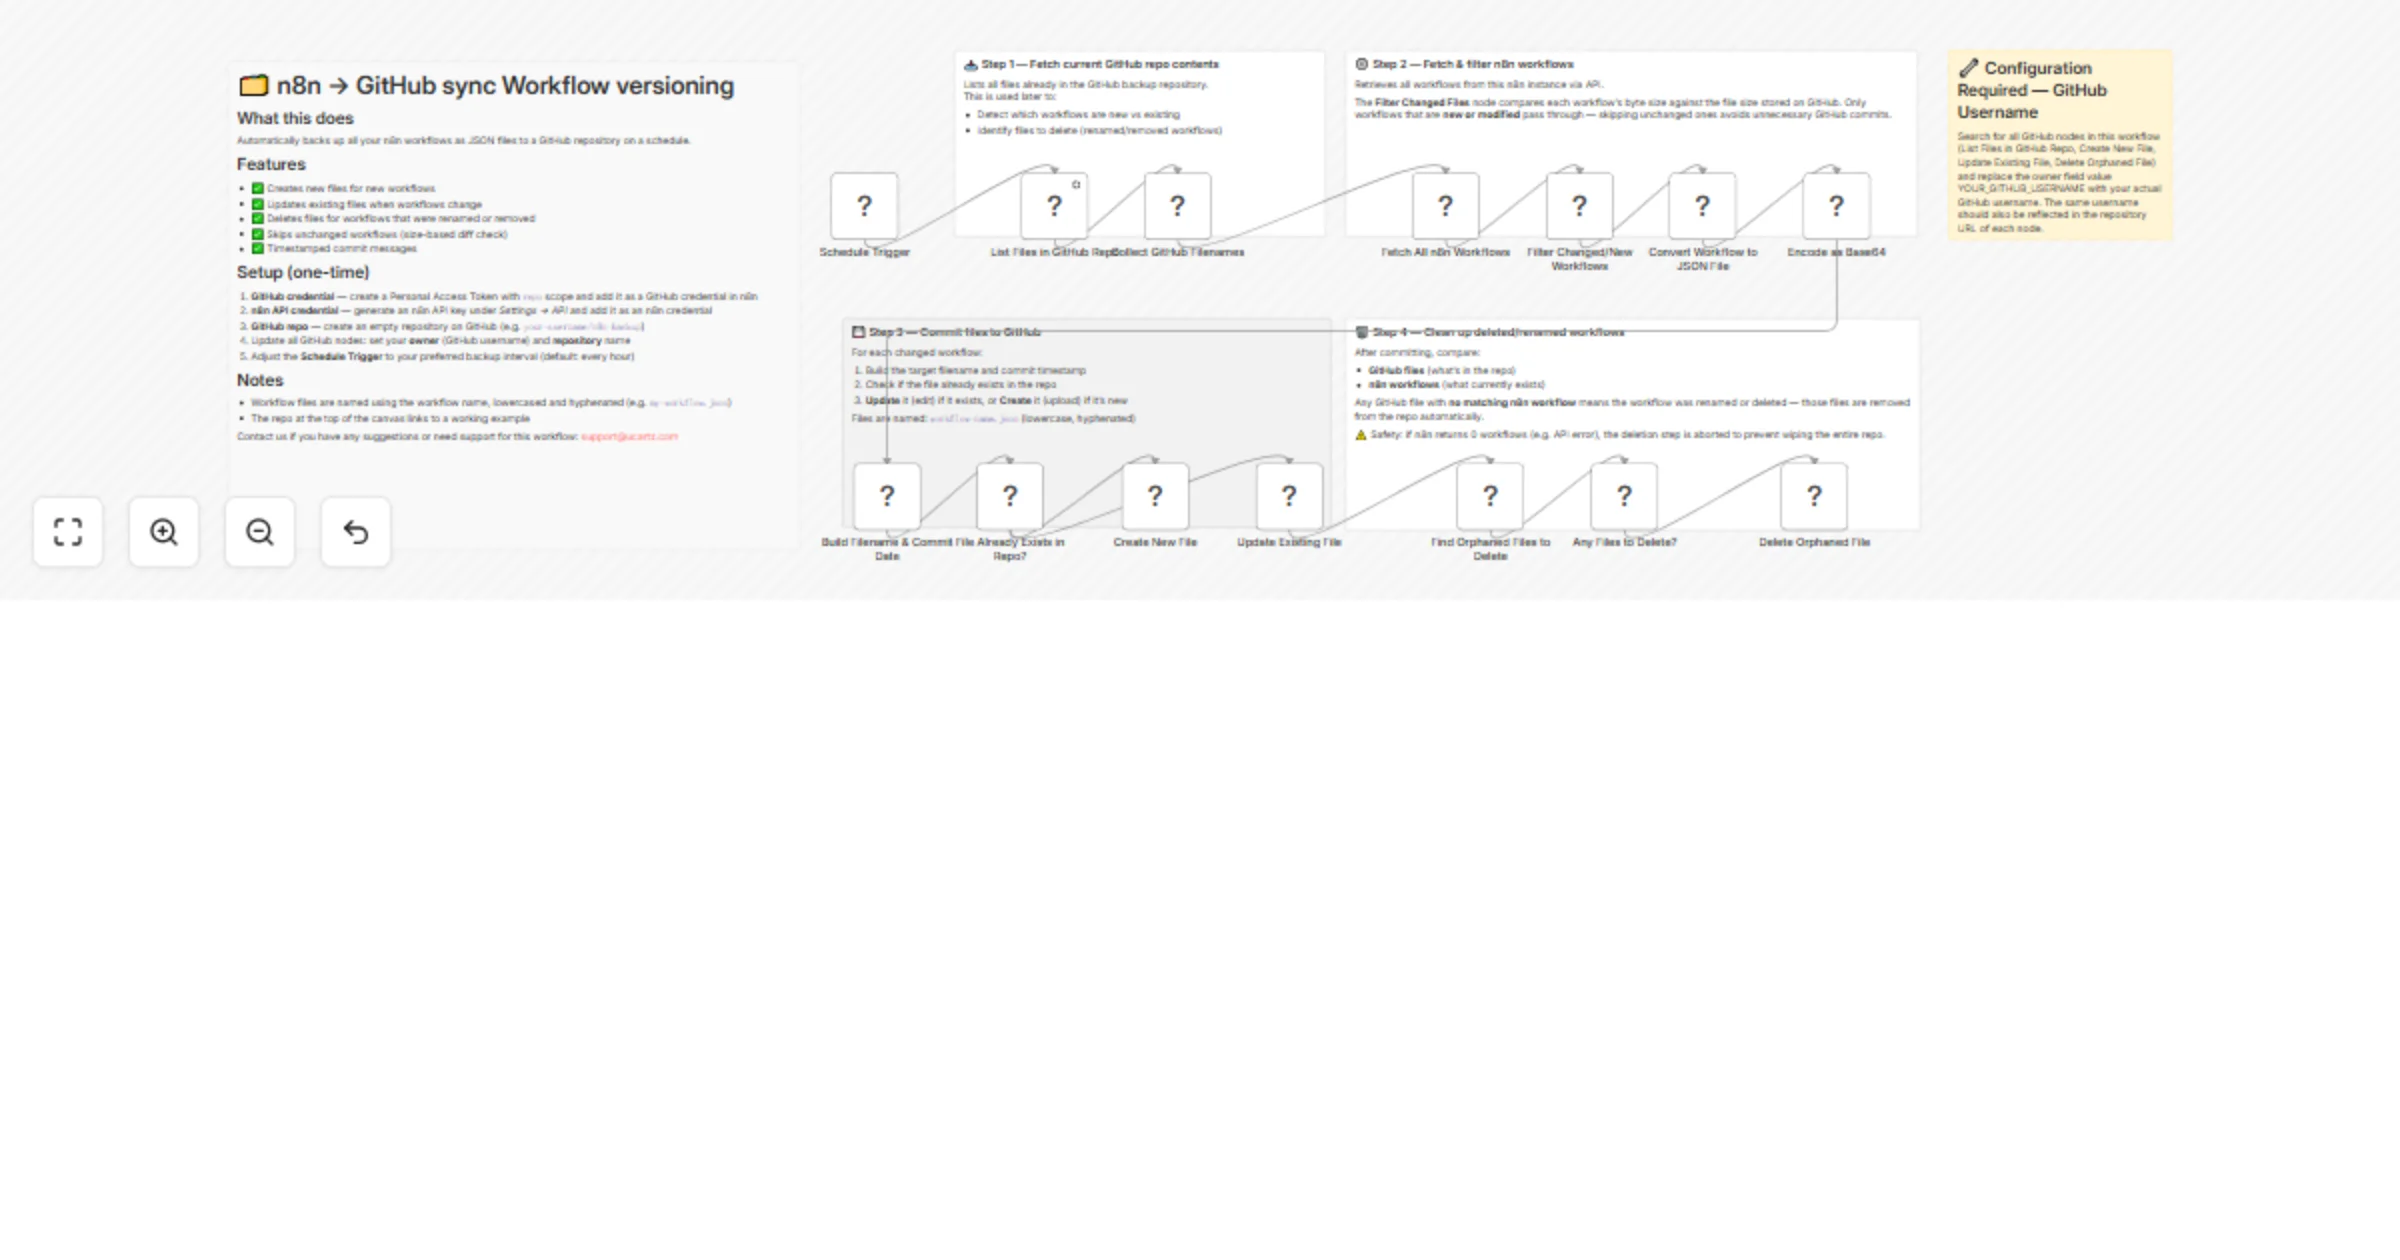
Sync self-hosted workflow backups to GitHub for version control
Automatically back up and sync your n8n workflows to GitHub with unlimited version control. This workflow ensures you...
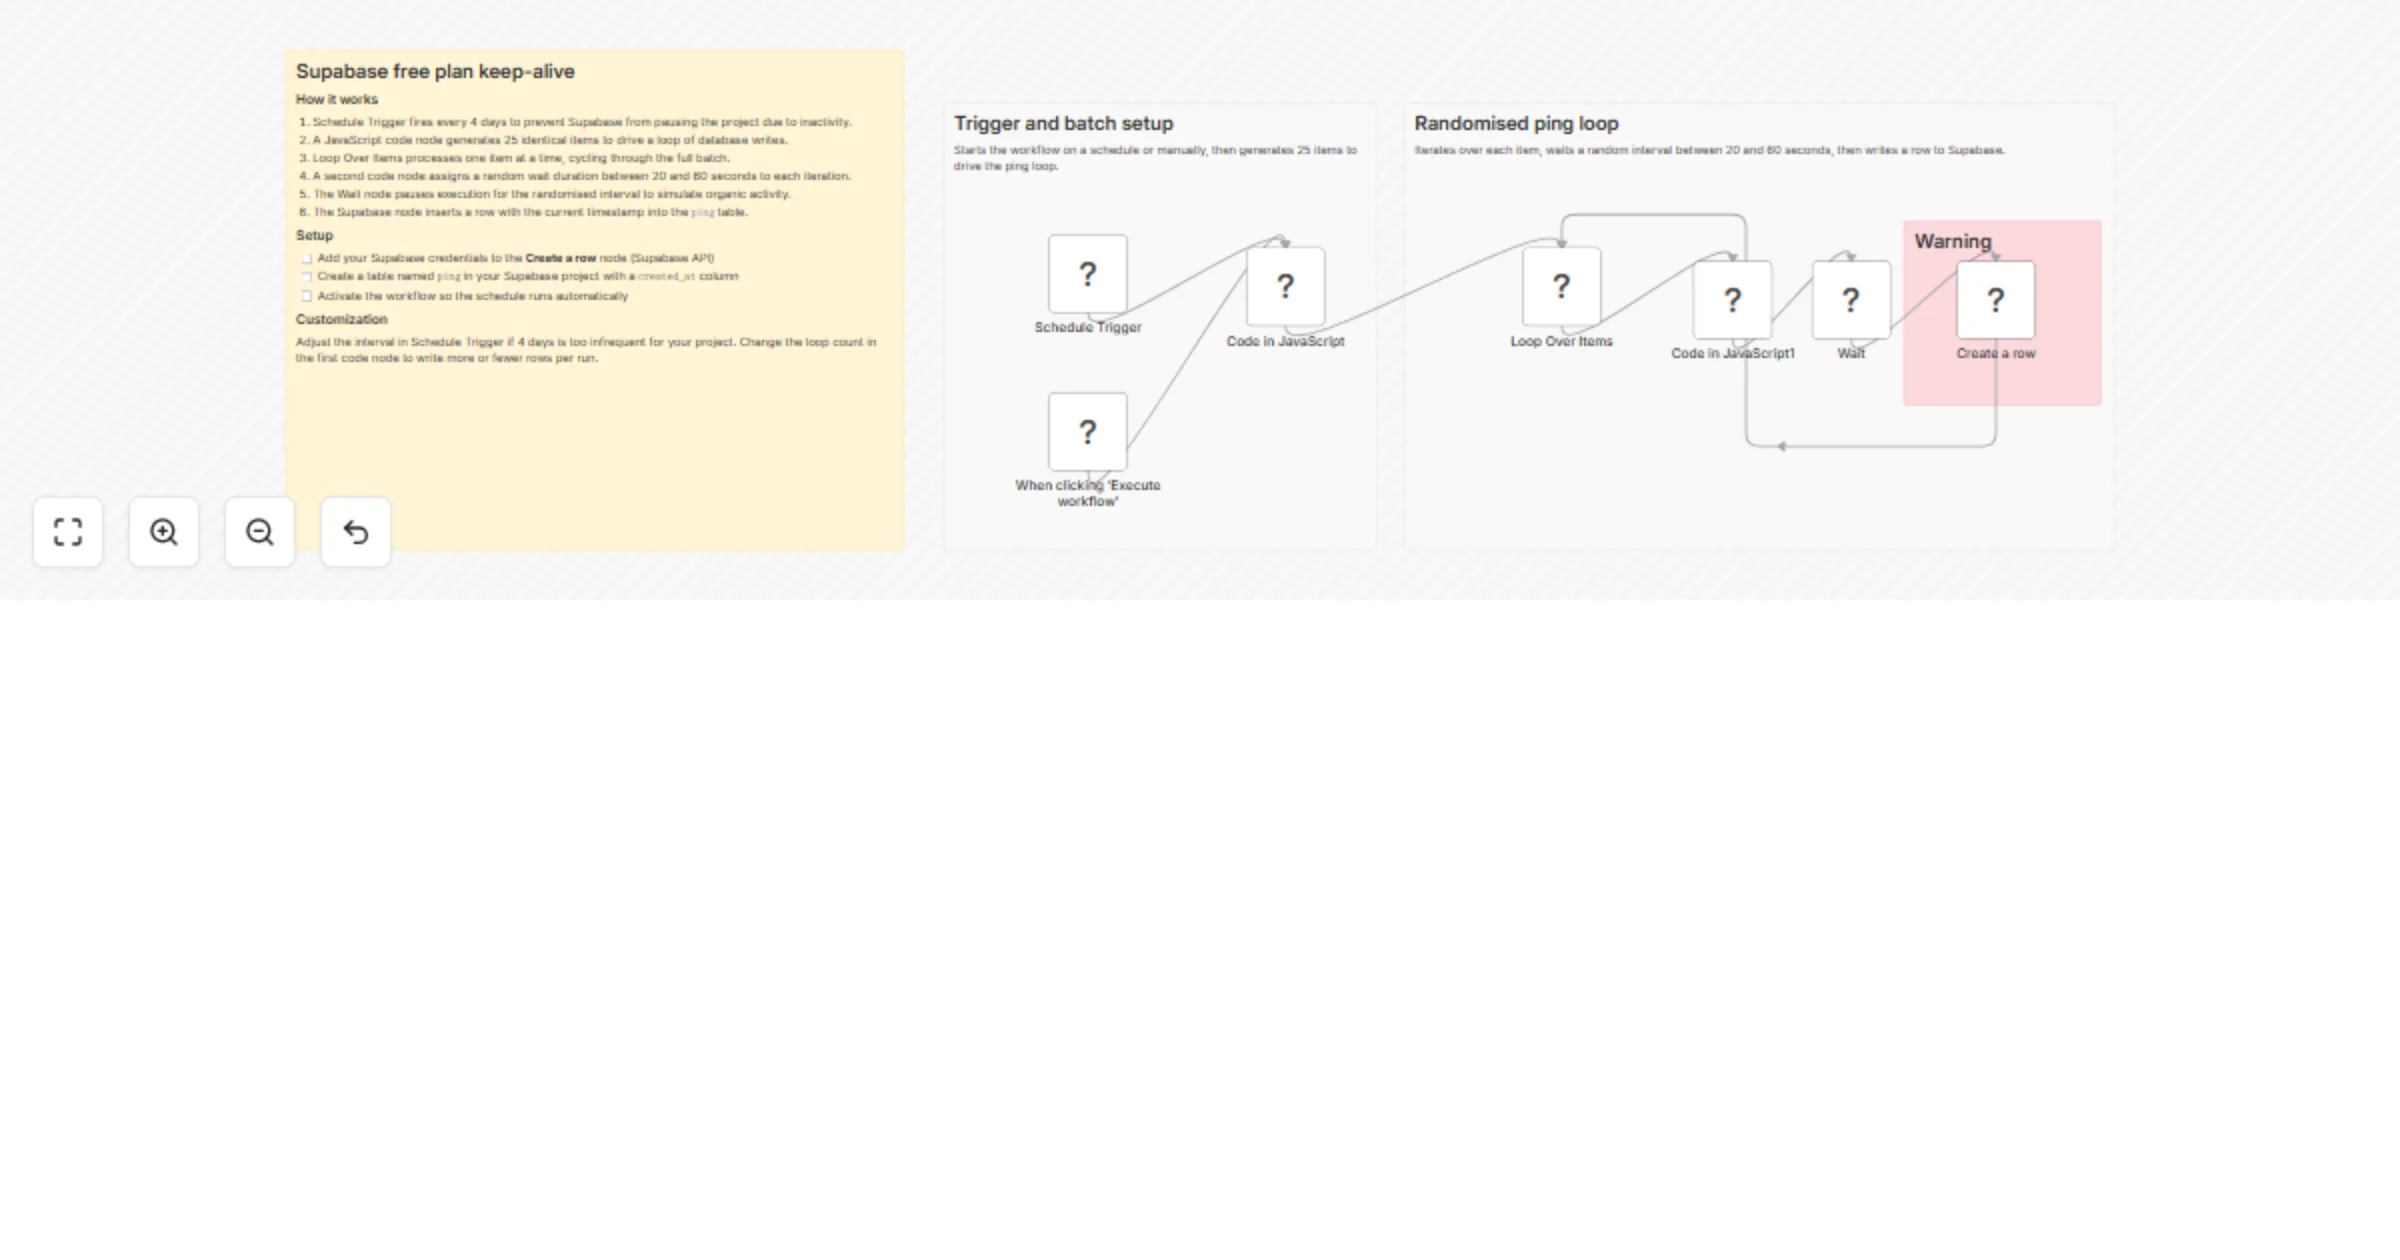
Keep Supabase free plan projects alive with scheduled database pings
Supabase Free Plan Keep Alive Prevents Supabase from pausing an inactive project by writing randomised pings to a dat...
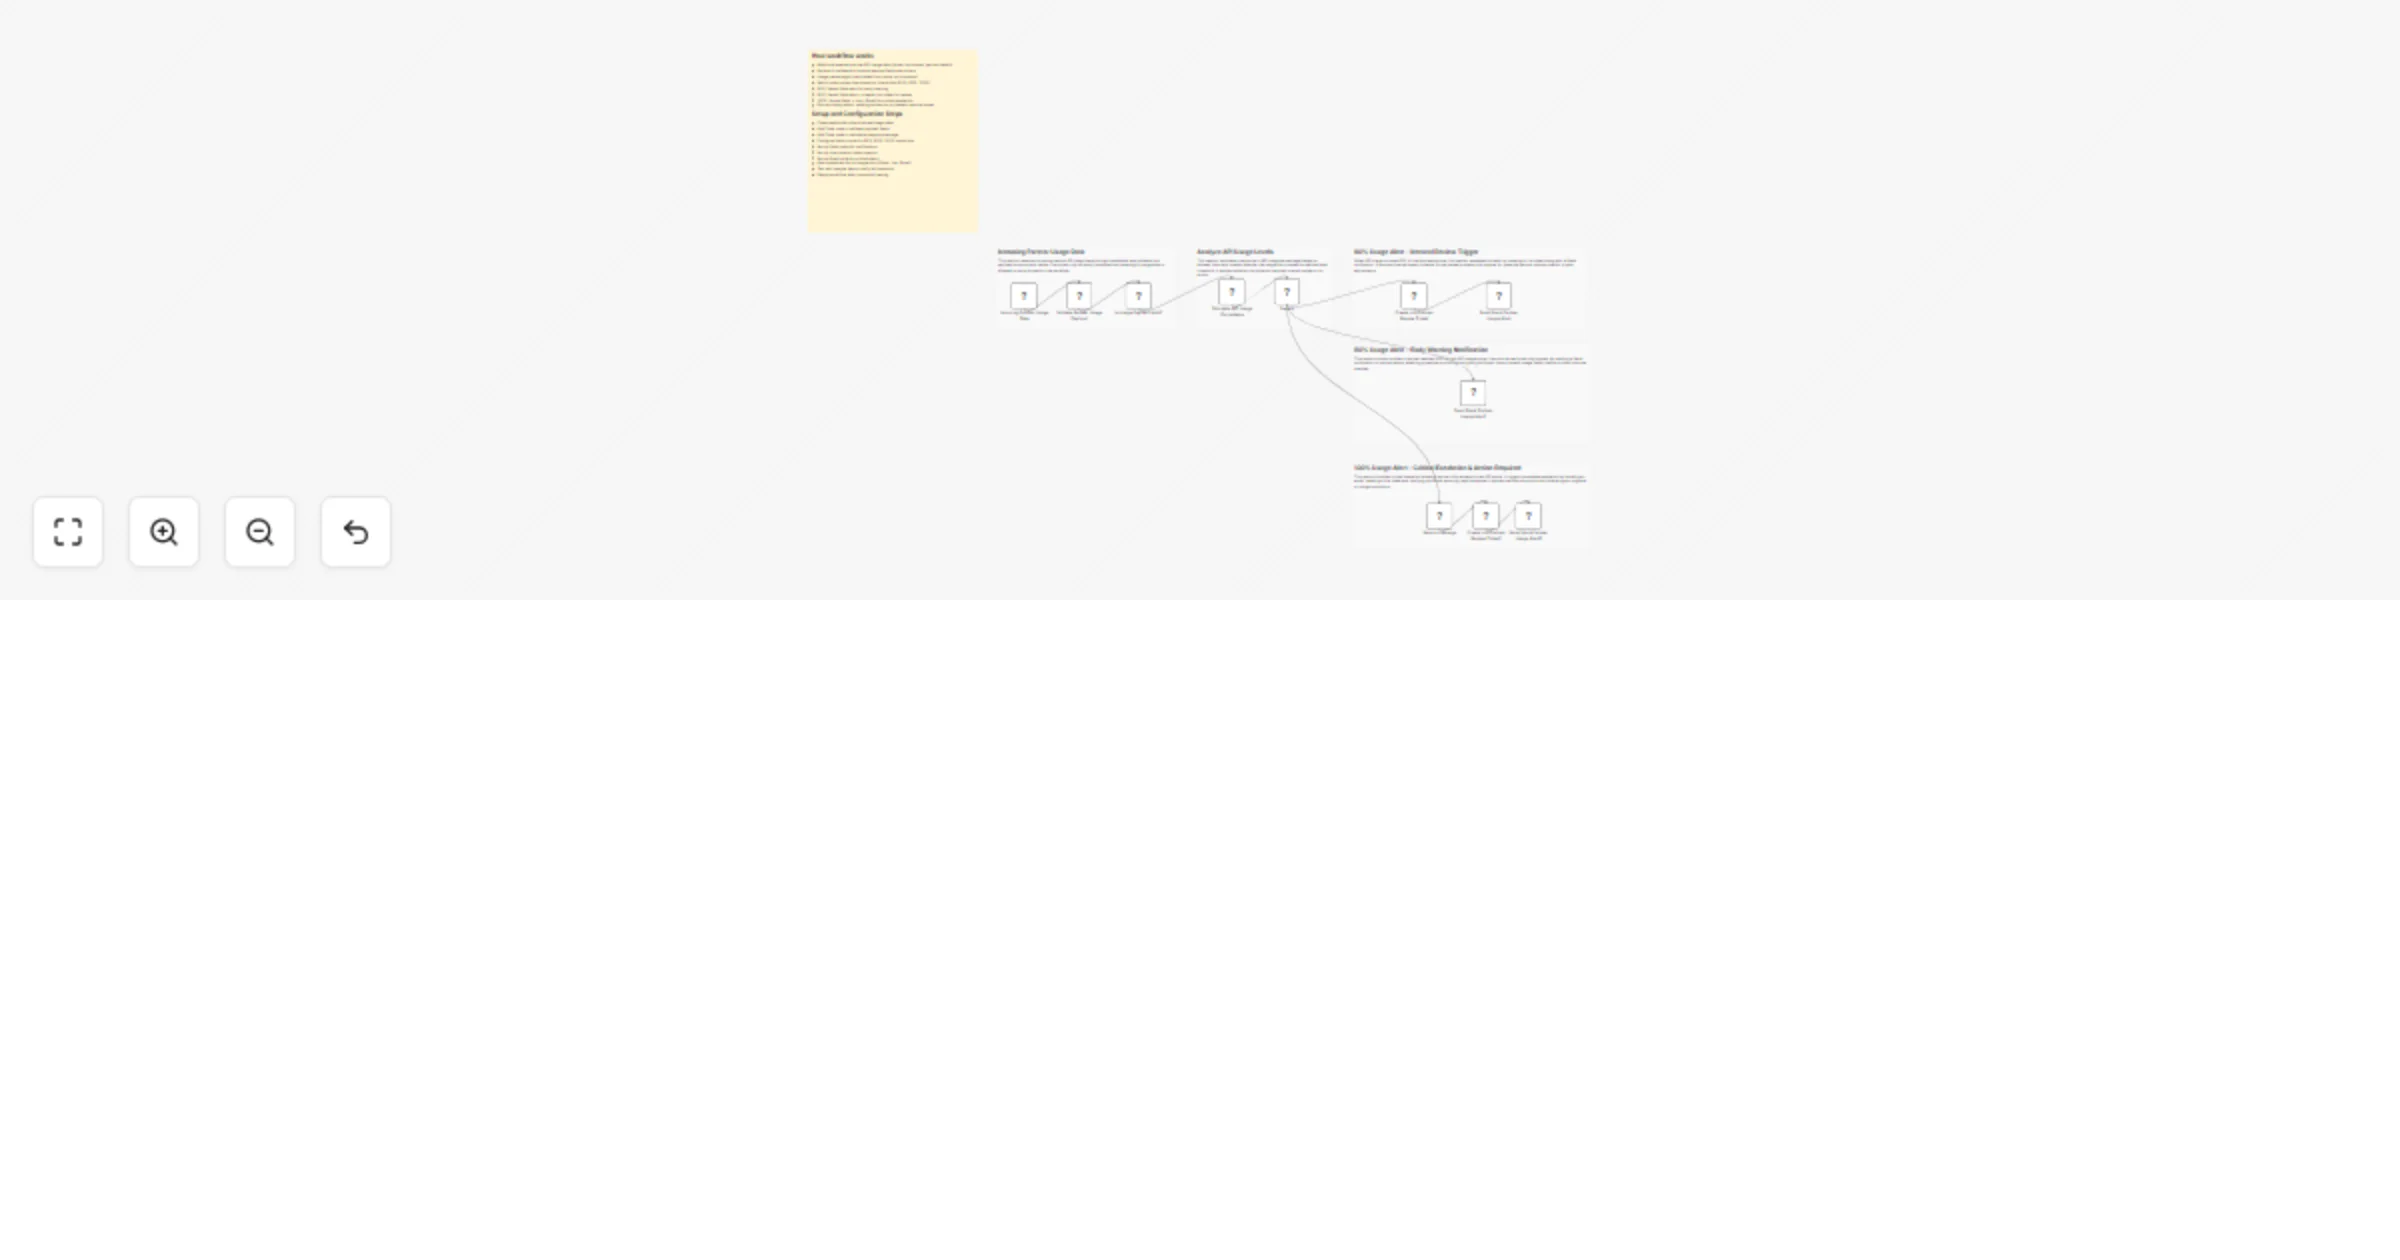
Monitor partner API usage with Slack, Jira and Gmail alerts
Smart Partner API Usage Monitoring with Slack, Jira & Gmail Alerts This workflow monitors partner API usage in real t...
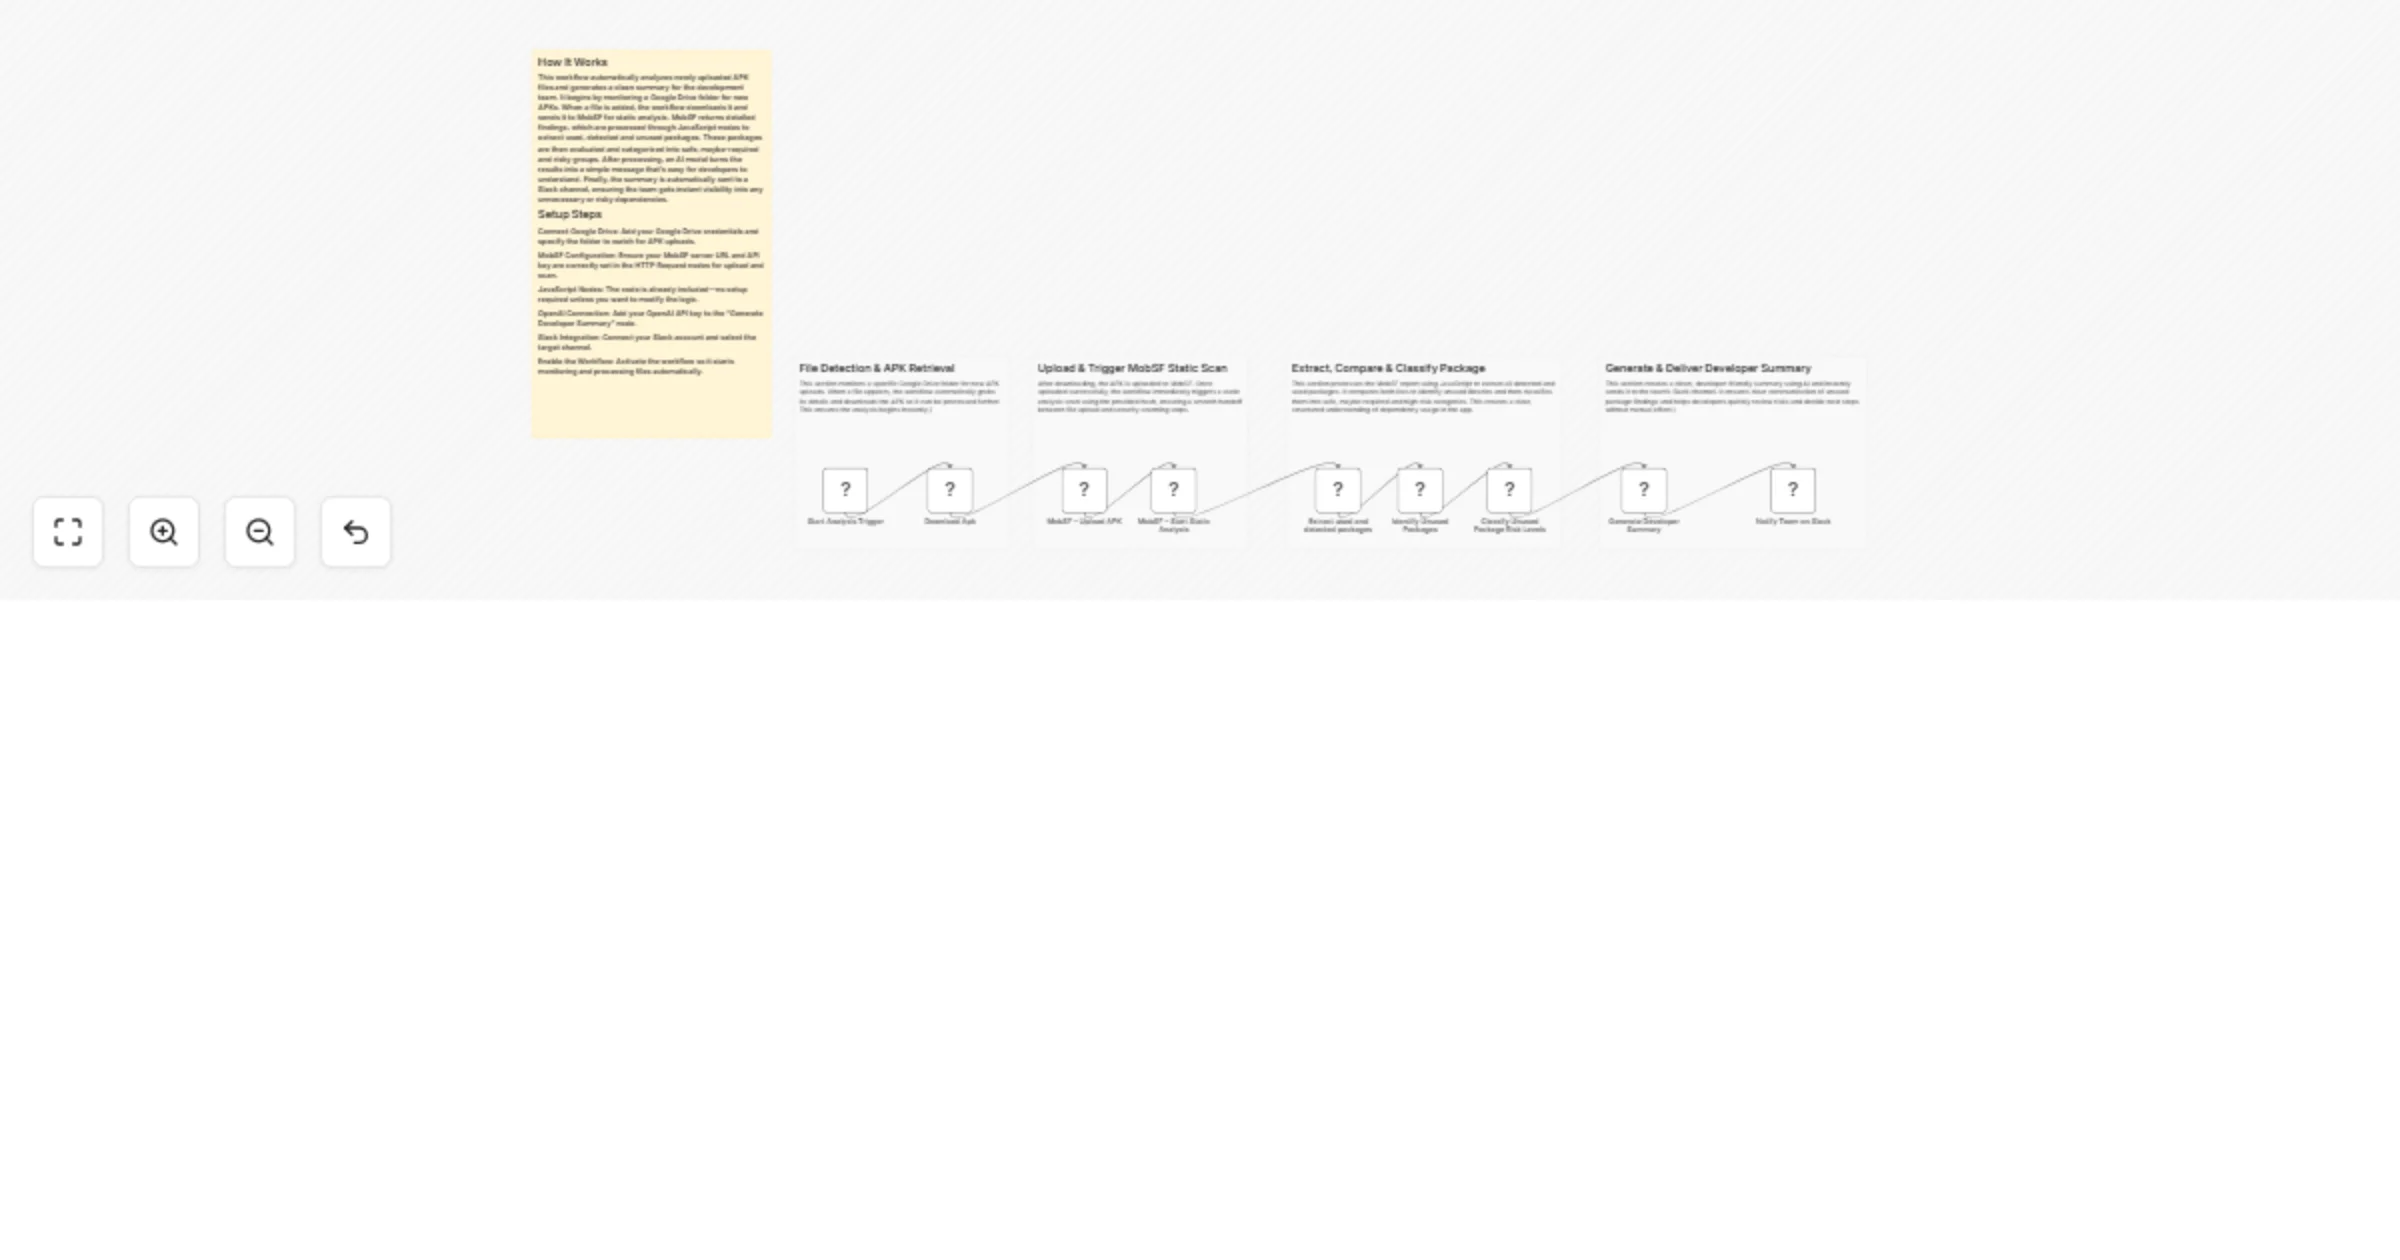
Monitor APK uploads and run MobSF analysis with OpenAI and Slack alerts
APK Upload Monitoring and Automated MobSF Analysis with Slack Reporting This workflow monitors a Google Drive folder...
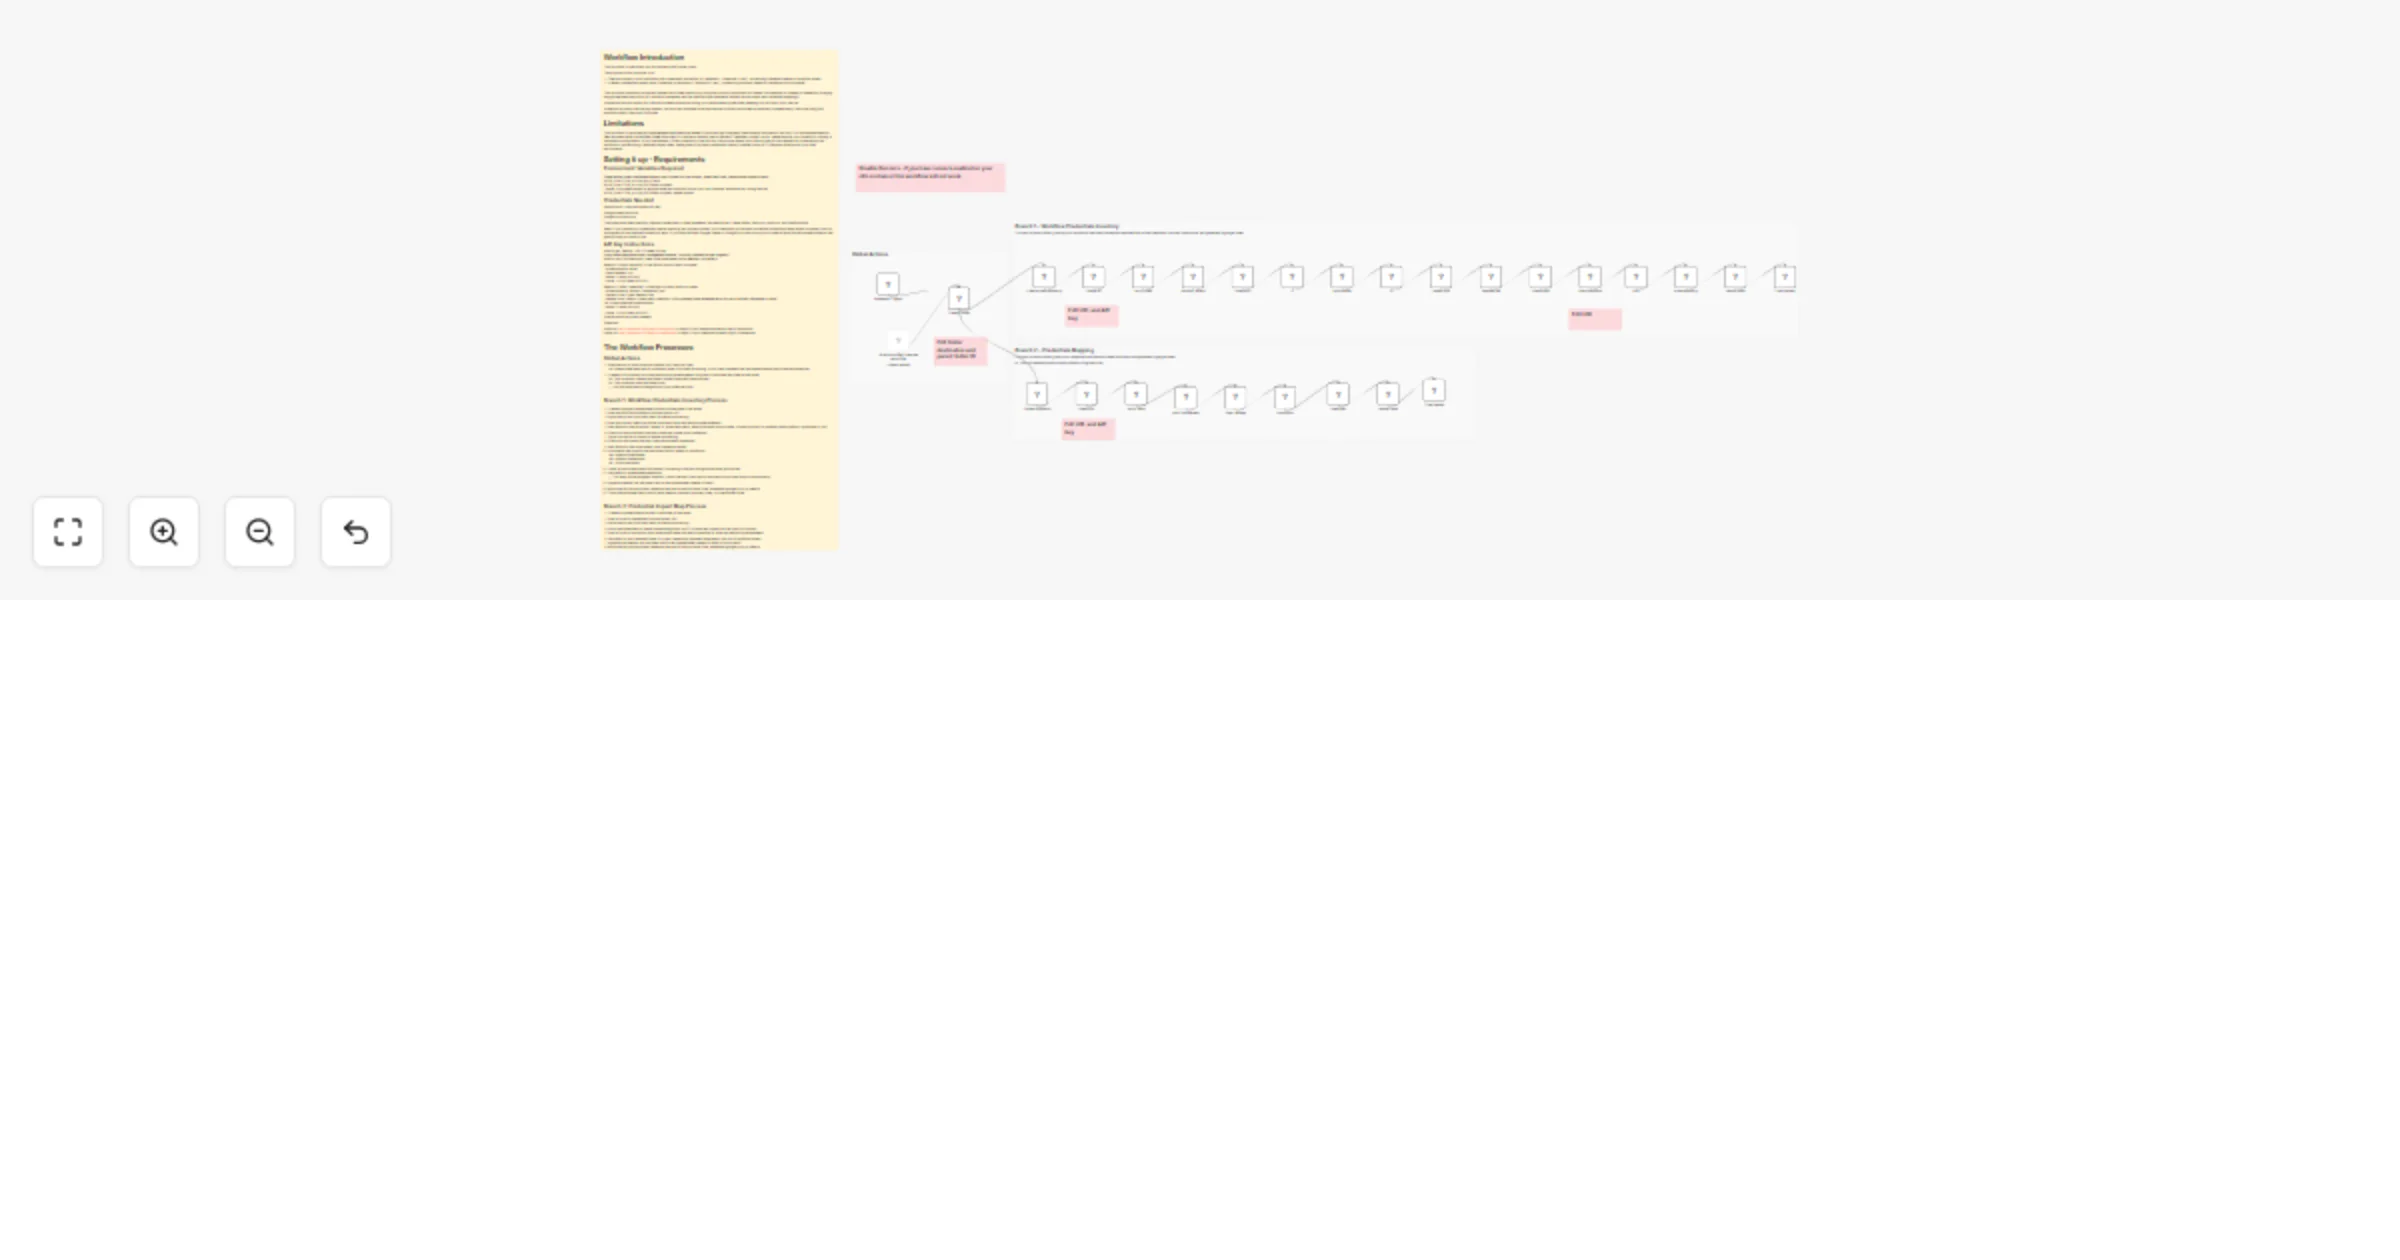
Audit workflow credential usage to Google Sheets using Google Drive and SQLite3
Workflow Introduction This workflow is specifically for Self Hosted N8N Docker users. The purpose of this workflow is...
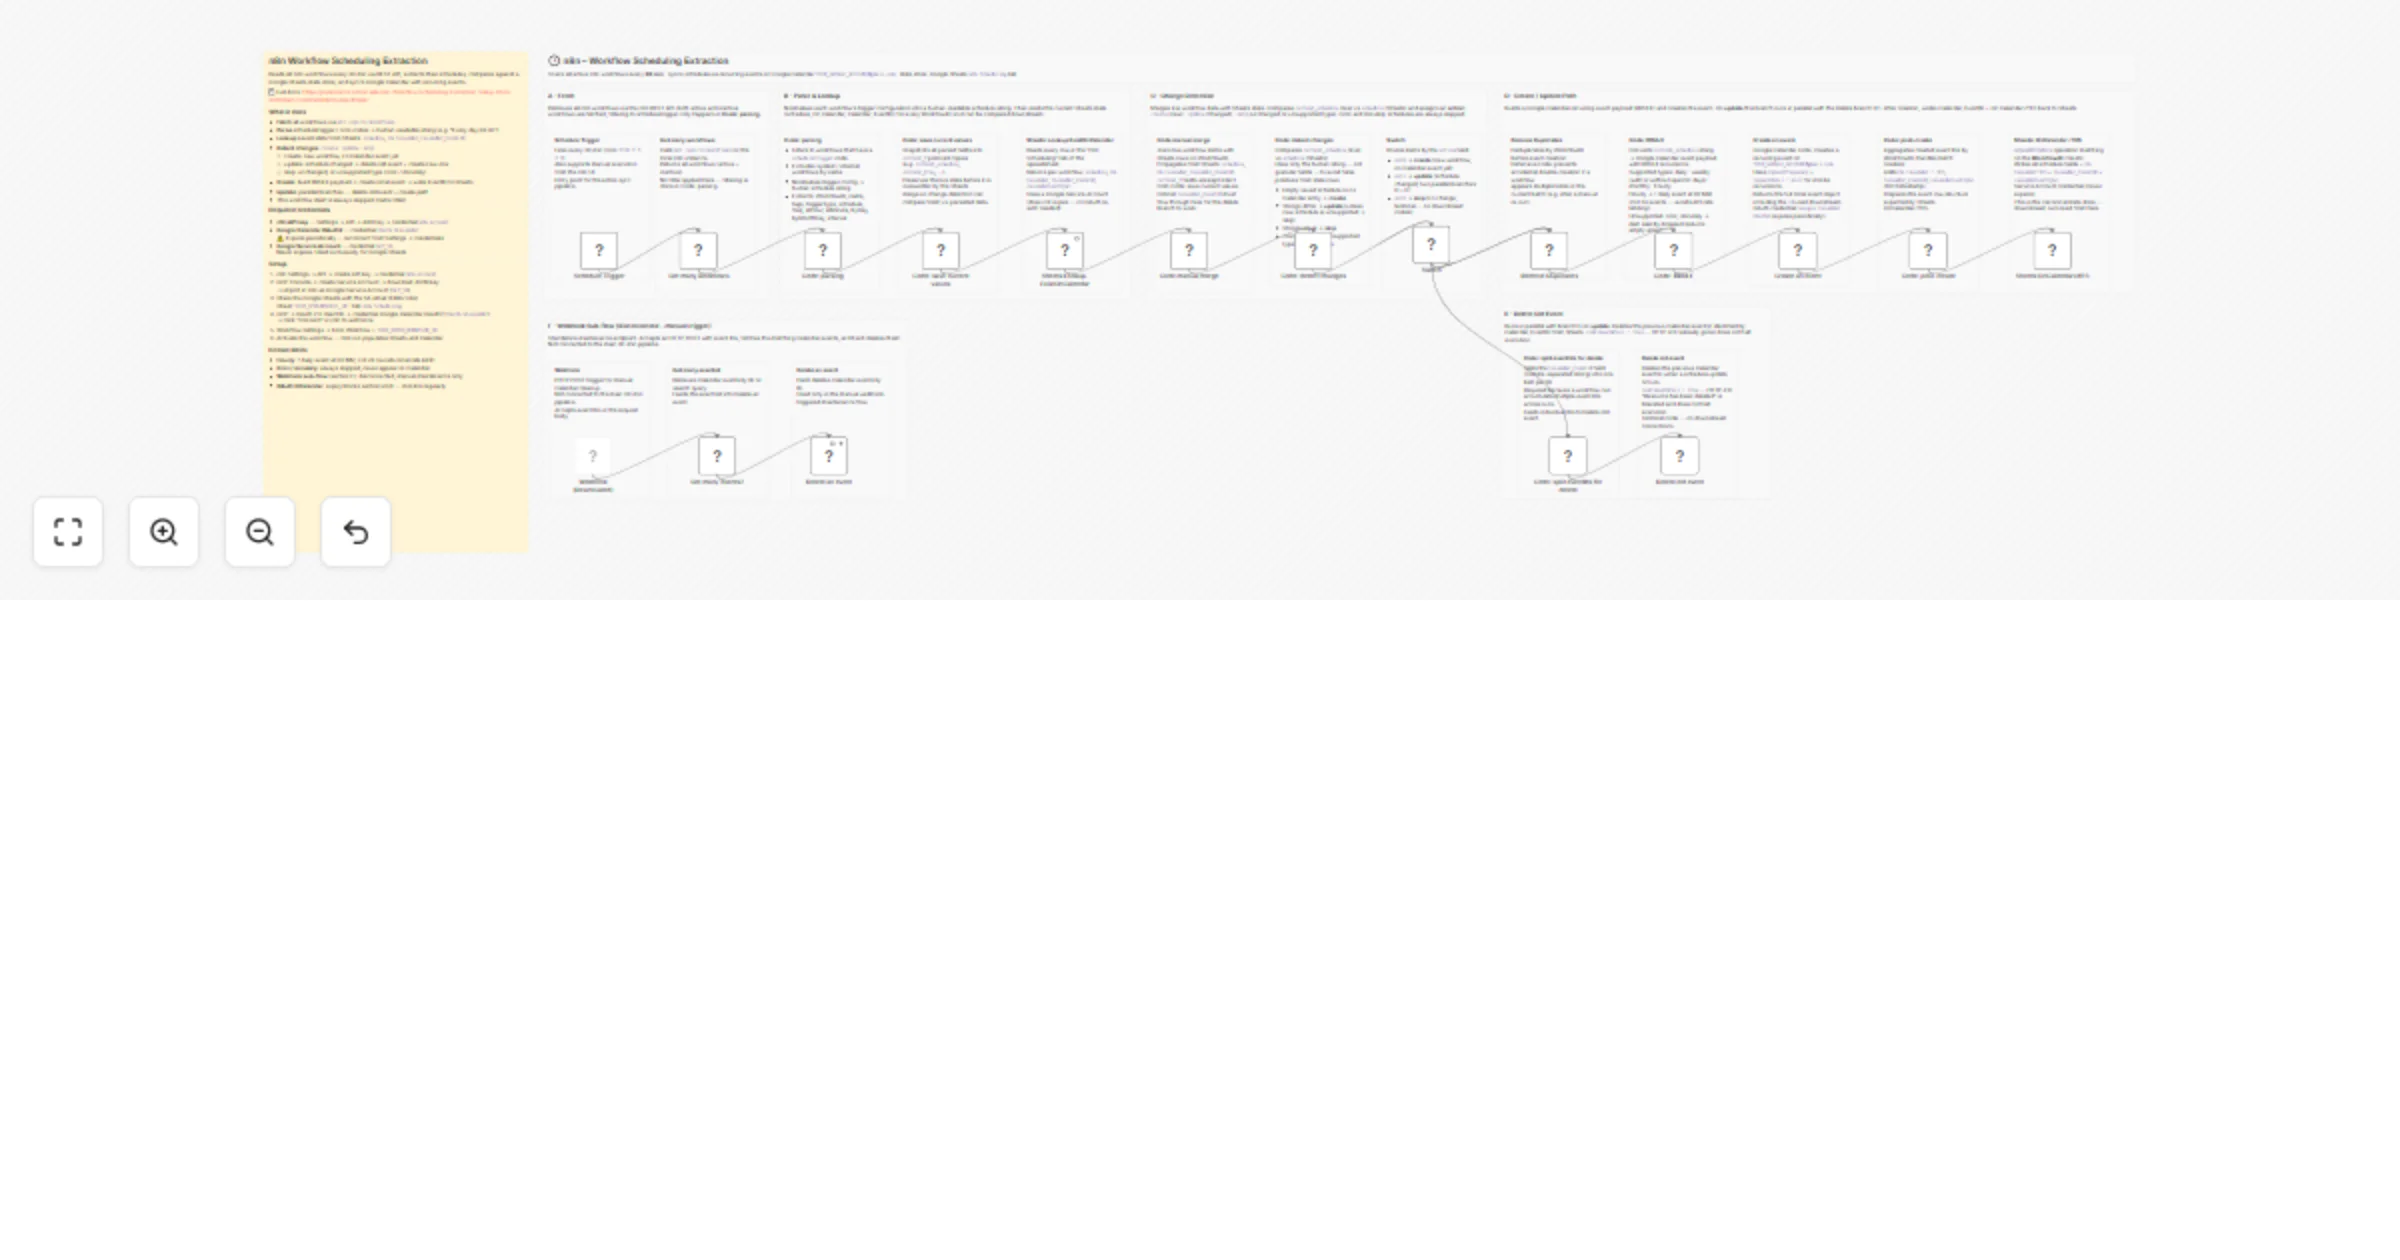
Sync workflow schedules between Google Sheets and Google Calendar
Sync n8n Workflow Schedules to Google Calendar Reads every workflow on your n8n instance every 30 minutes, extracts t...
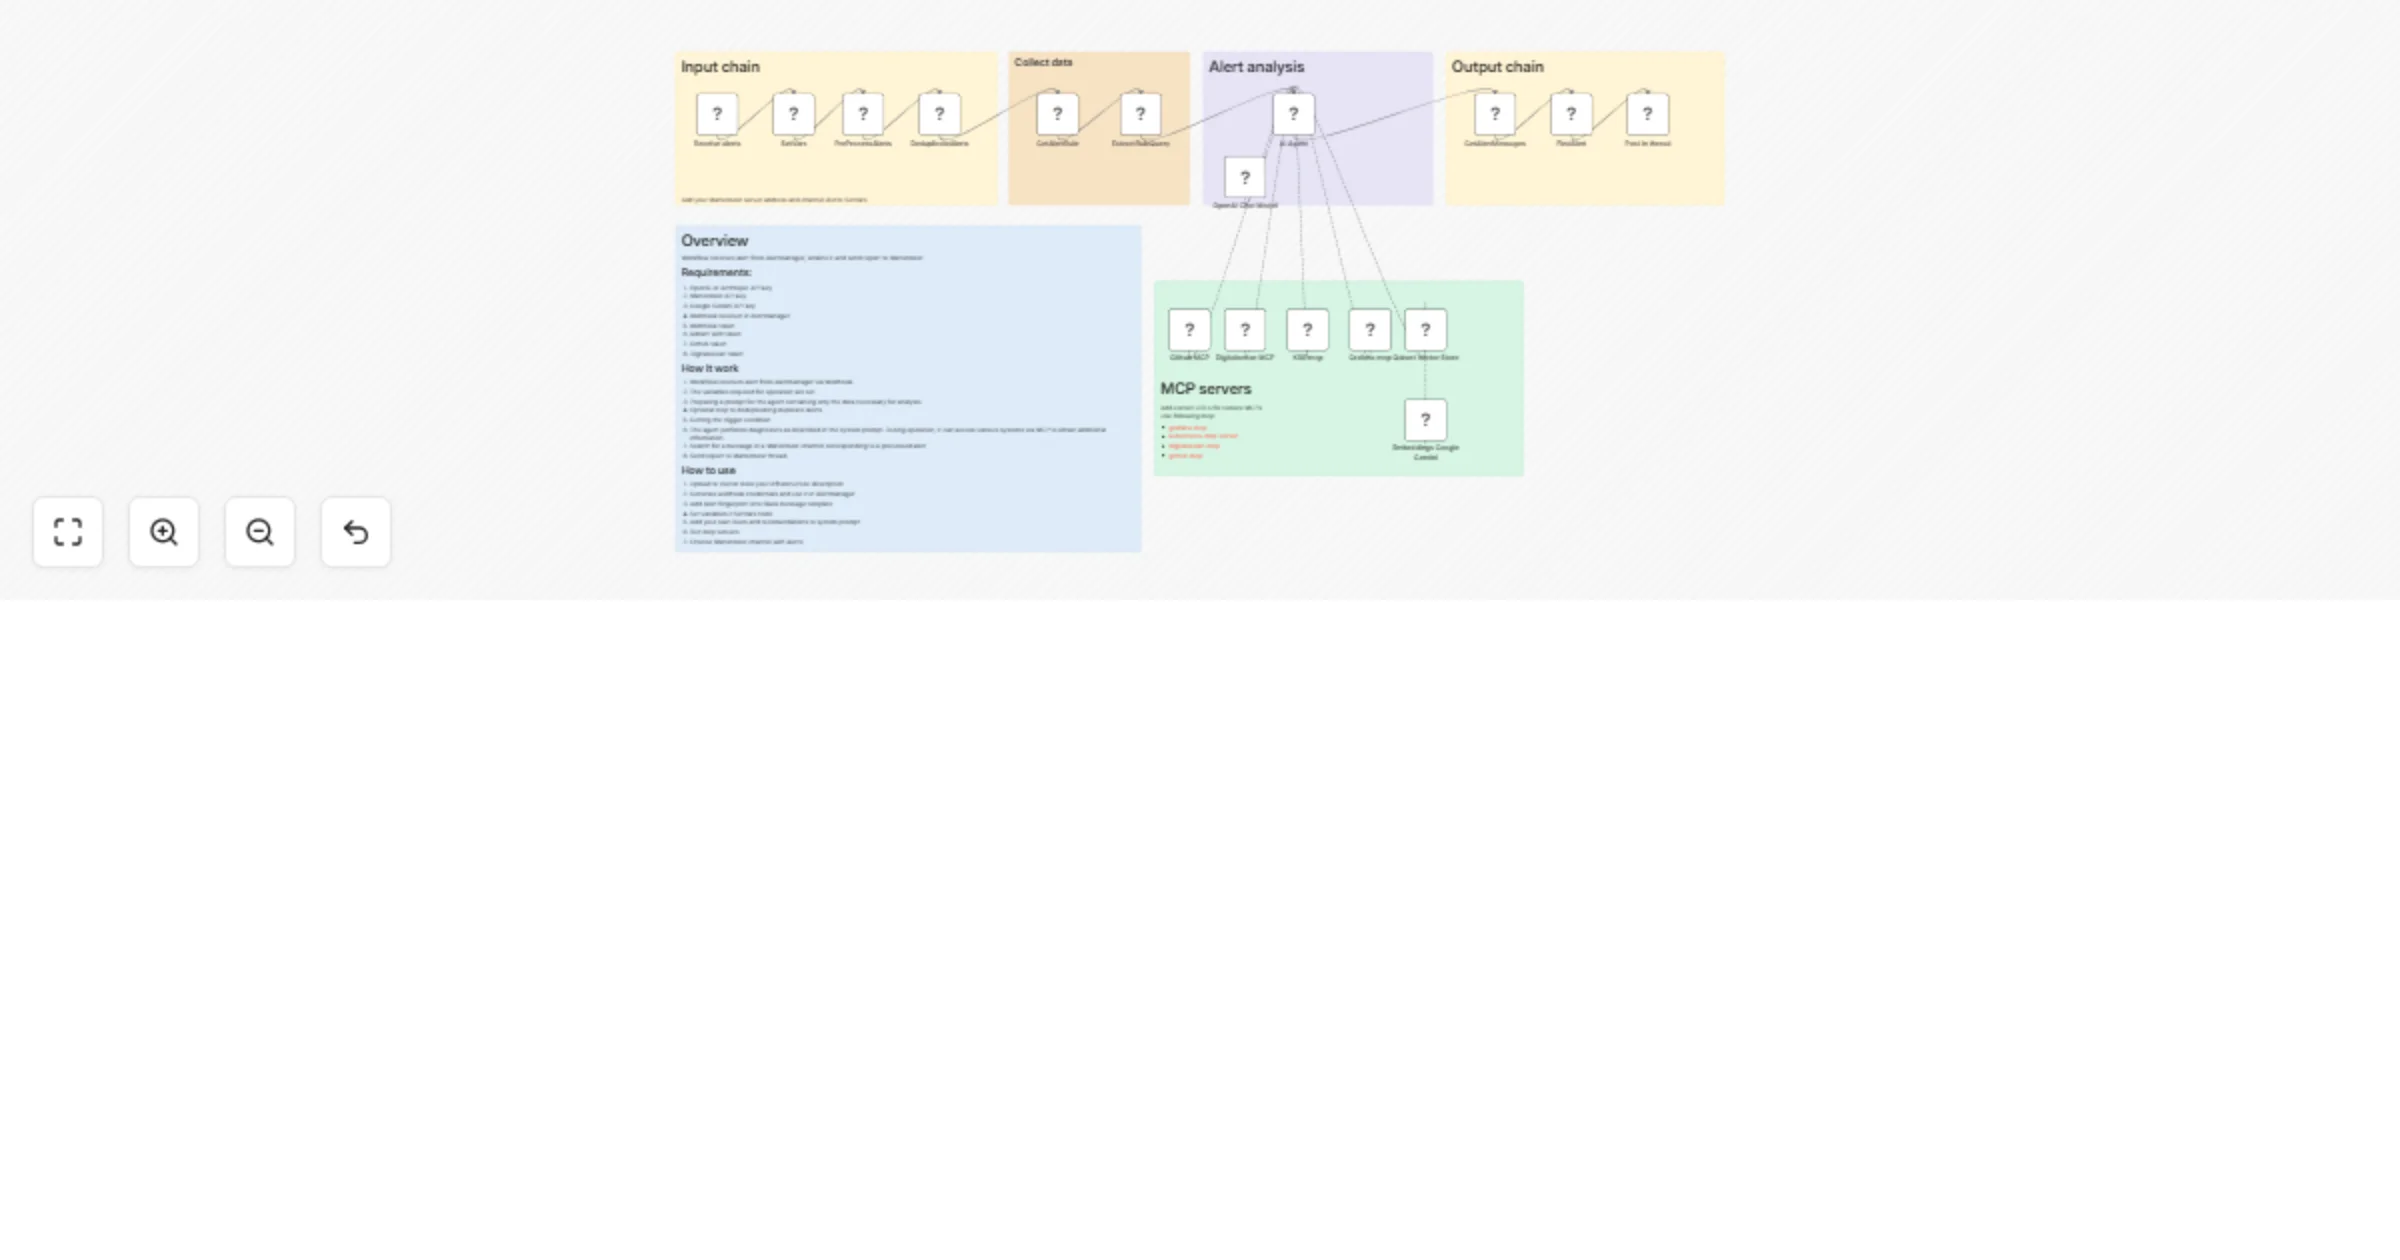
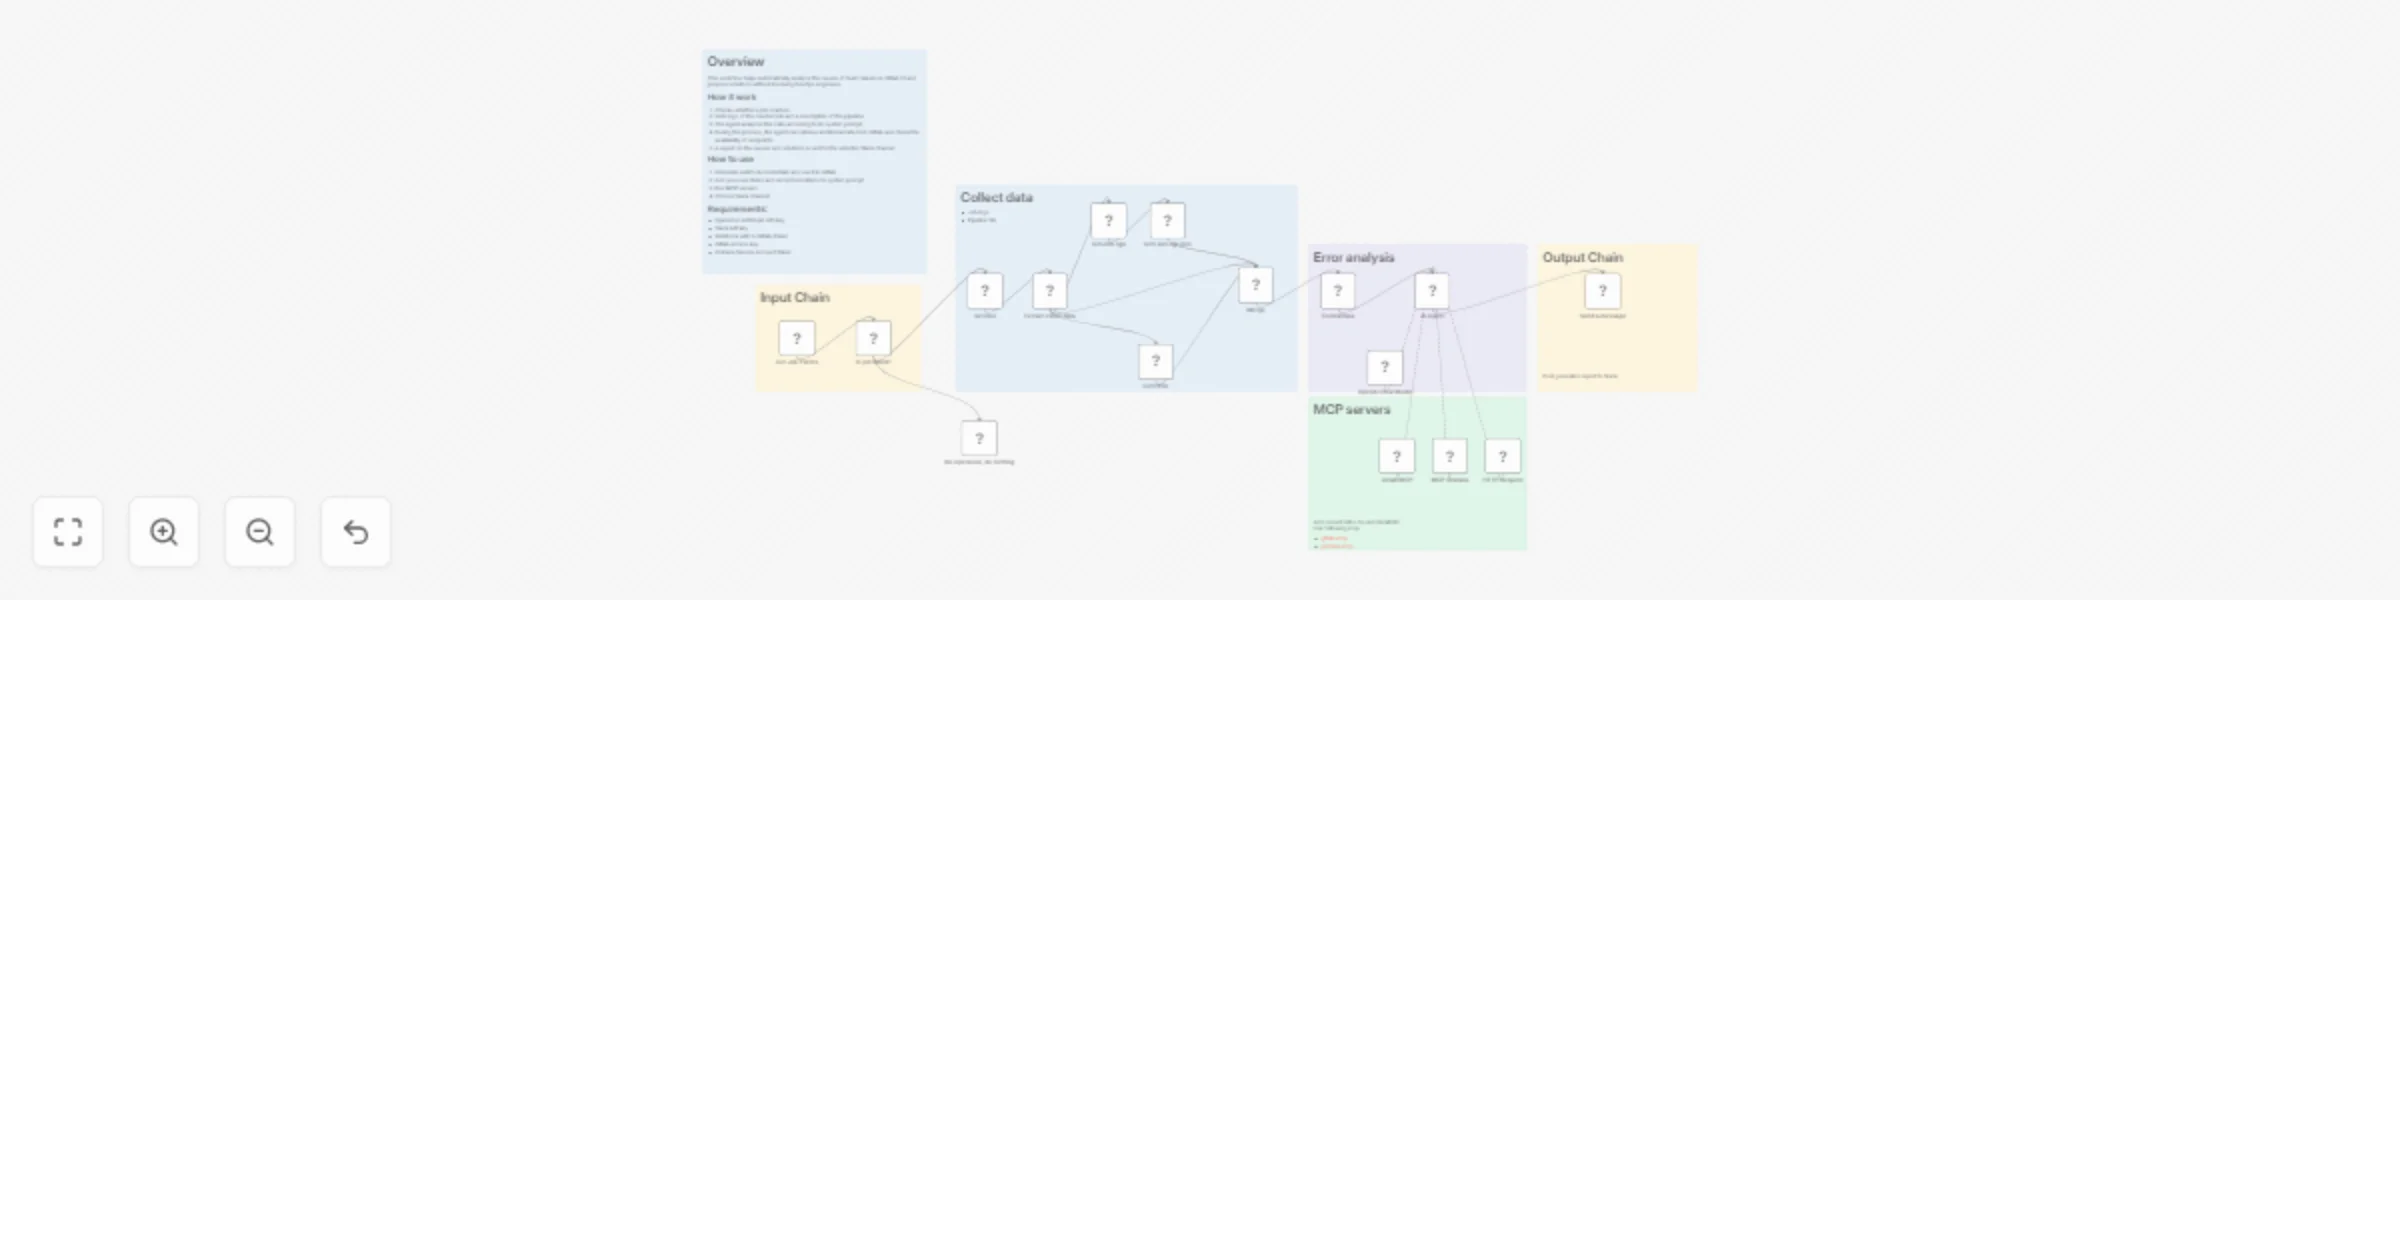
Analyze alerts from Alertmanager and send diagnostic reports to Slack
Overview This workflow helps automatically analyze alerts occurring in the infrastructure and suggest solutions even...
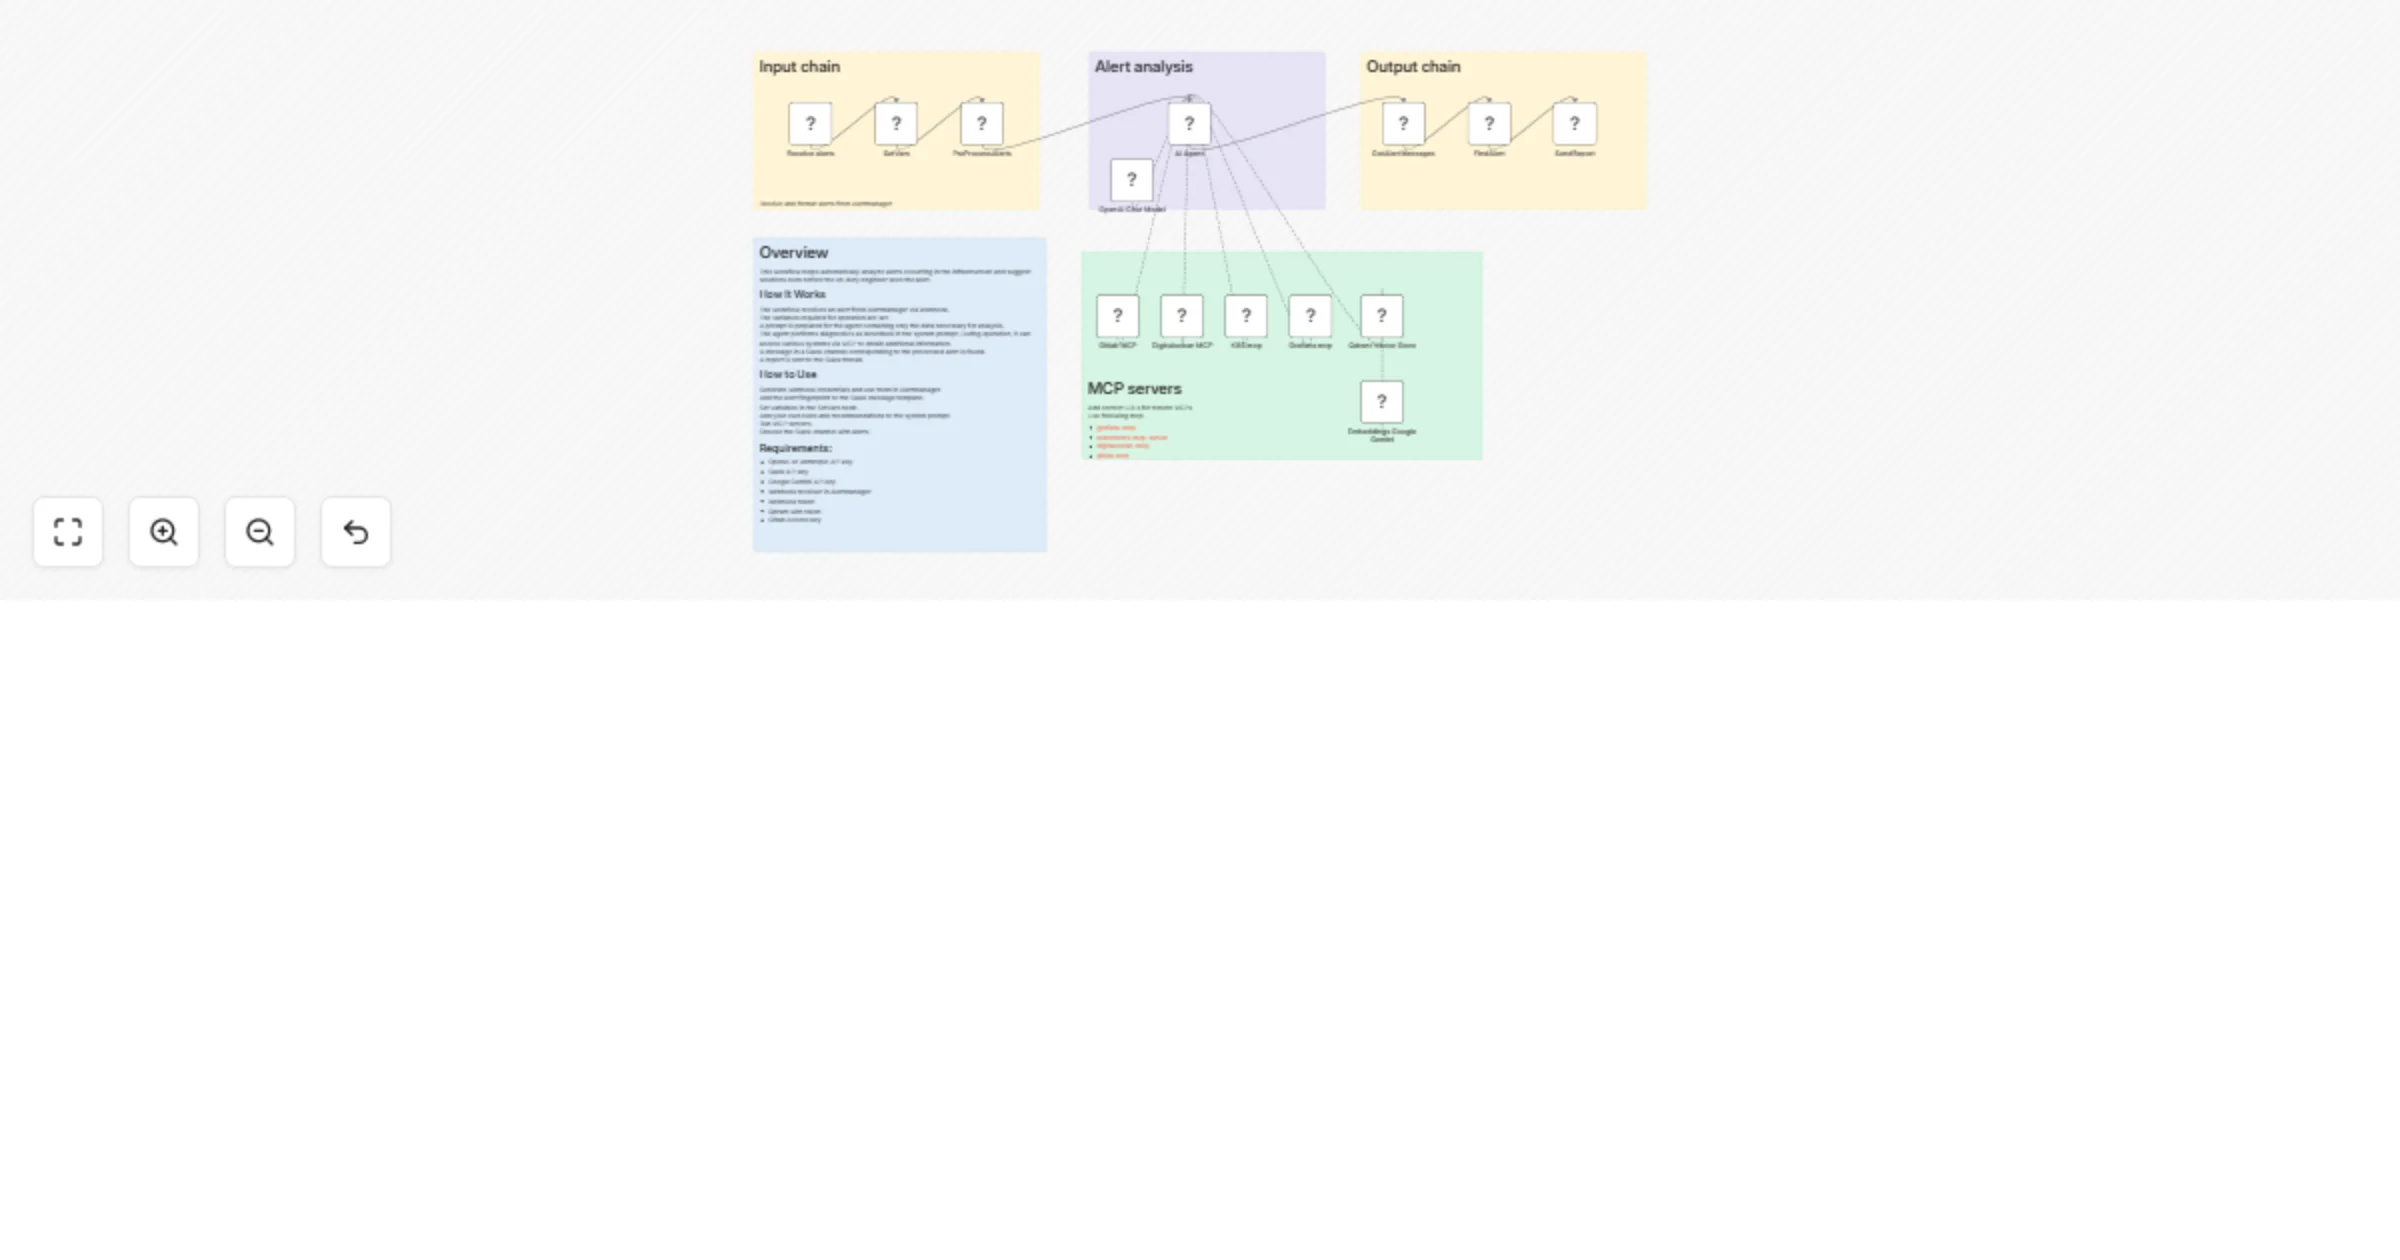
Analyze Alertmanager incidents and post diagnostic reports to Mattermost
Overview This workflow helps automatically analyze alerts occurring in the infrastructure and suggest solutions even...
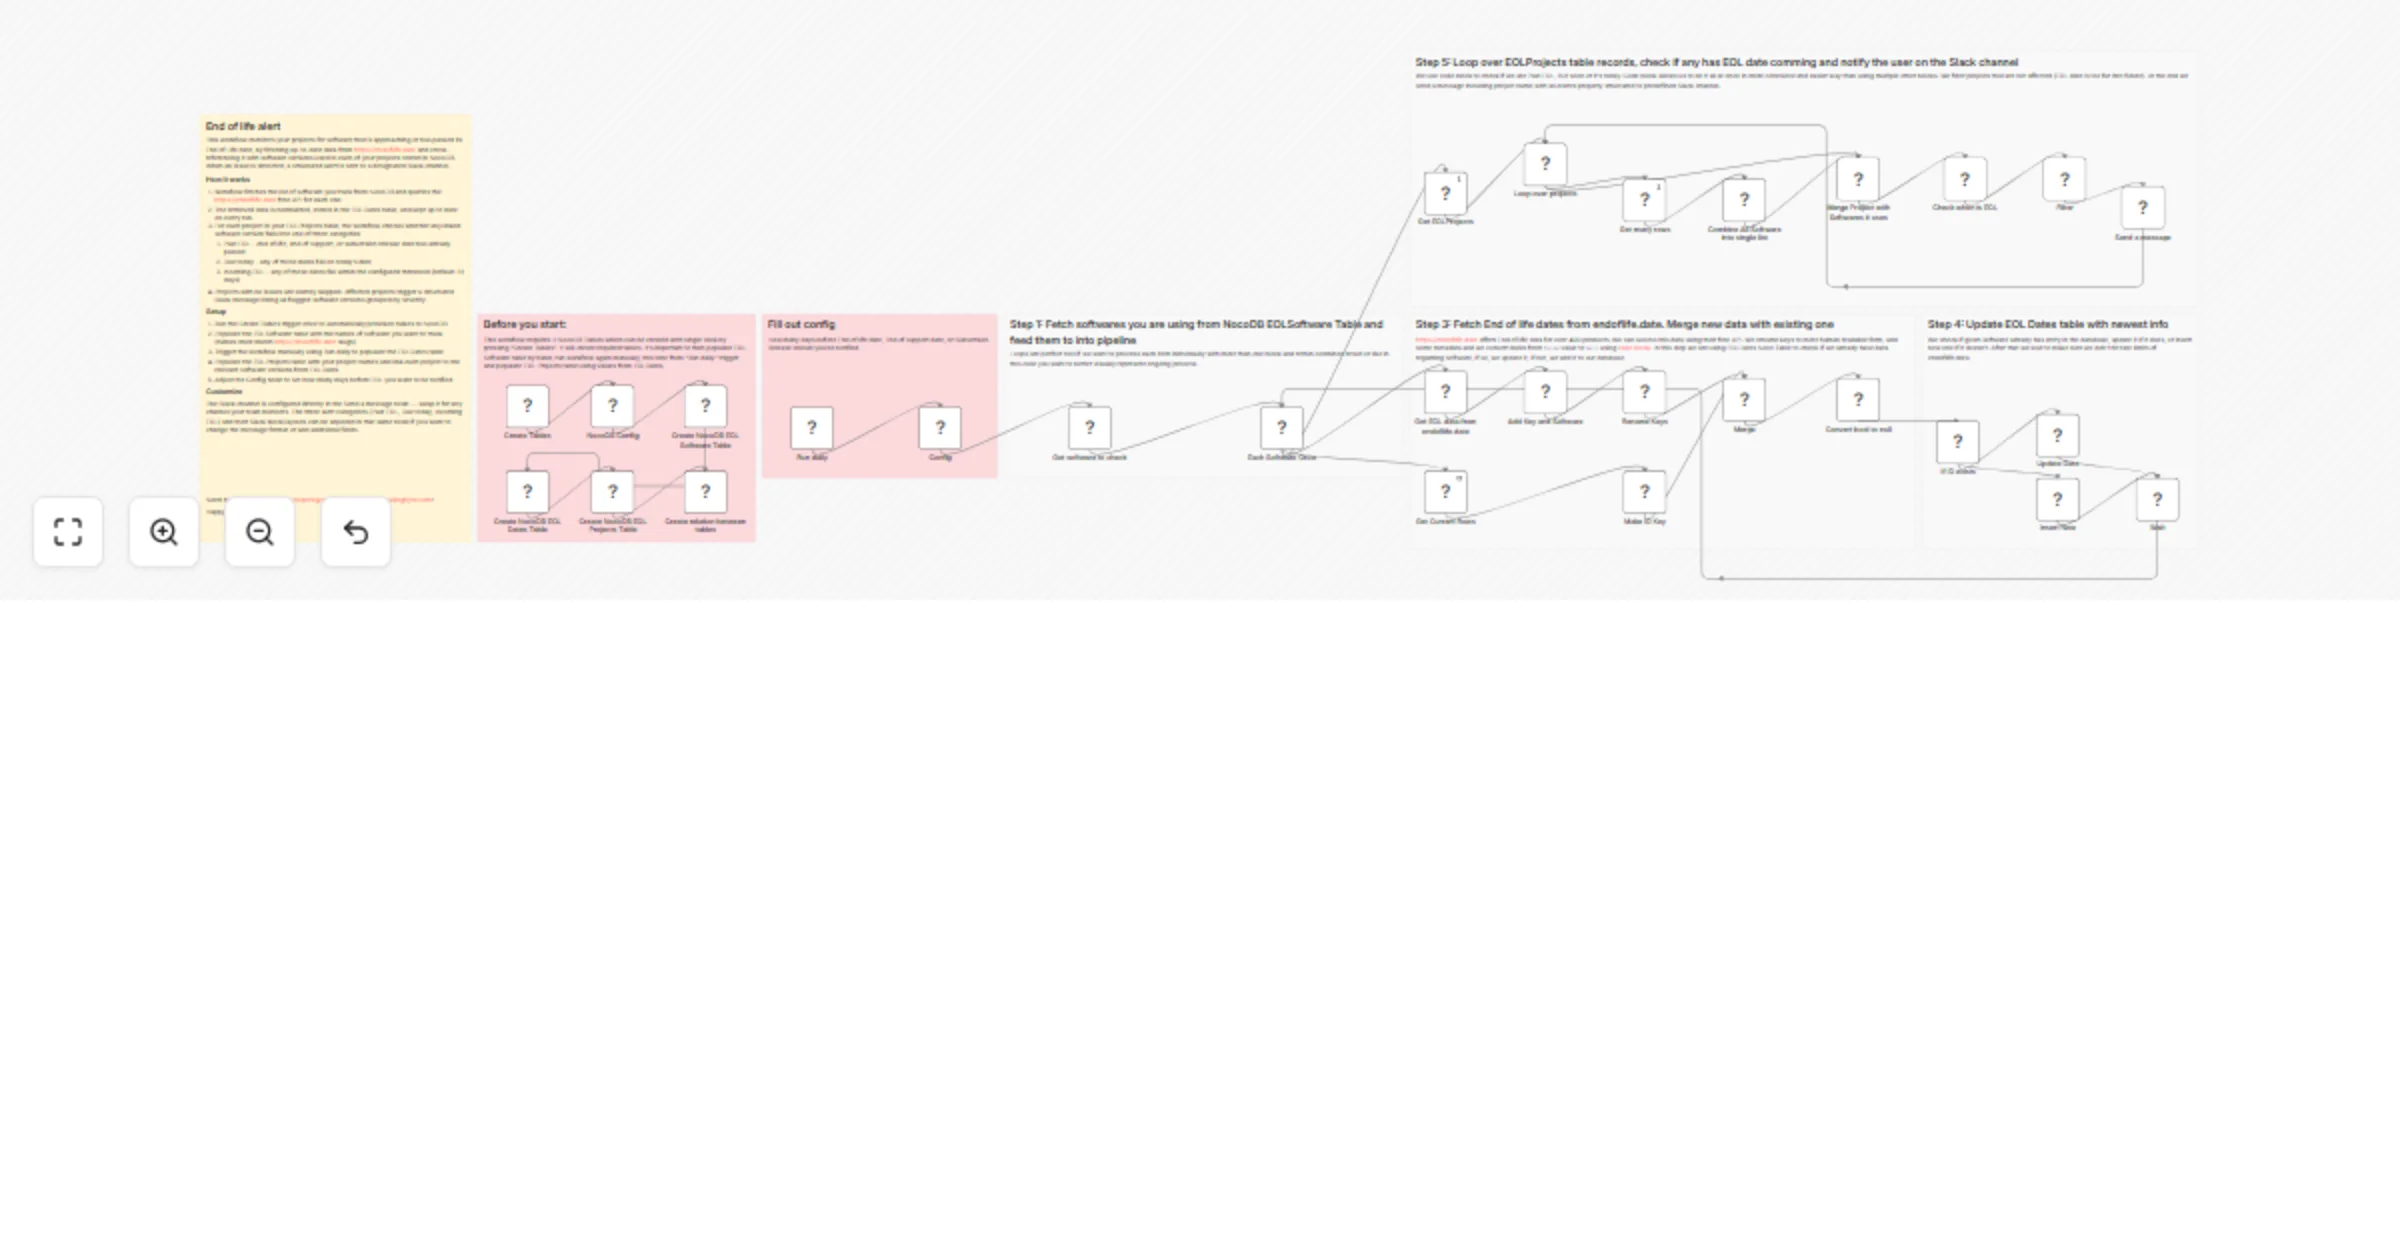
Send end-of-life software alerts using NocoDB, endoflife.date, and Slack
What Is This? This workflow is an automated system that tracks End of Life (EOL) dates for software and technologies...
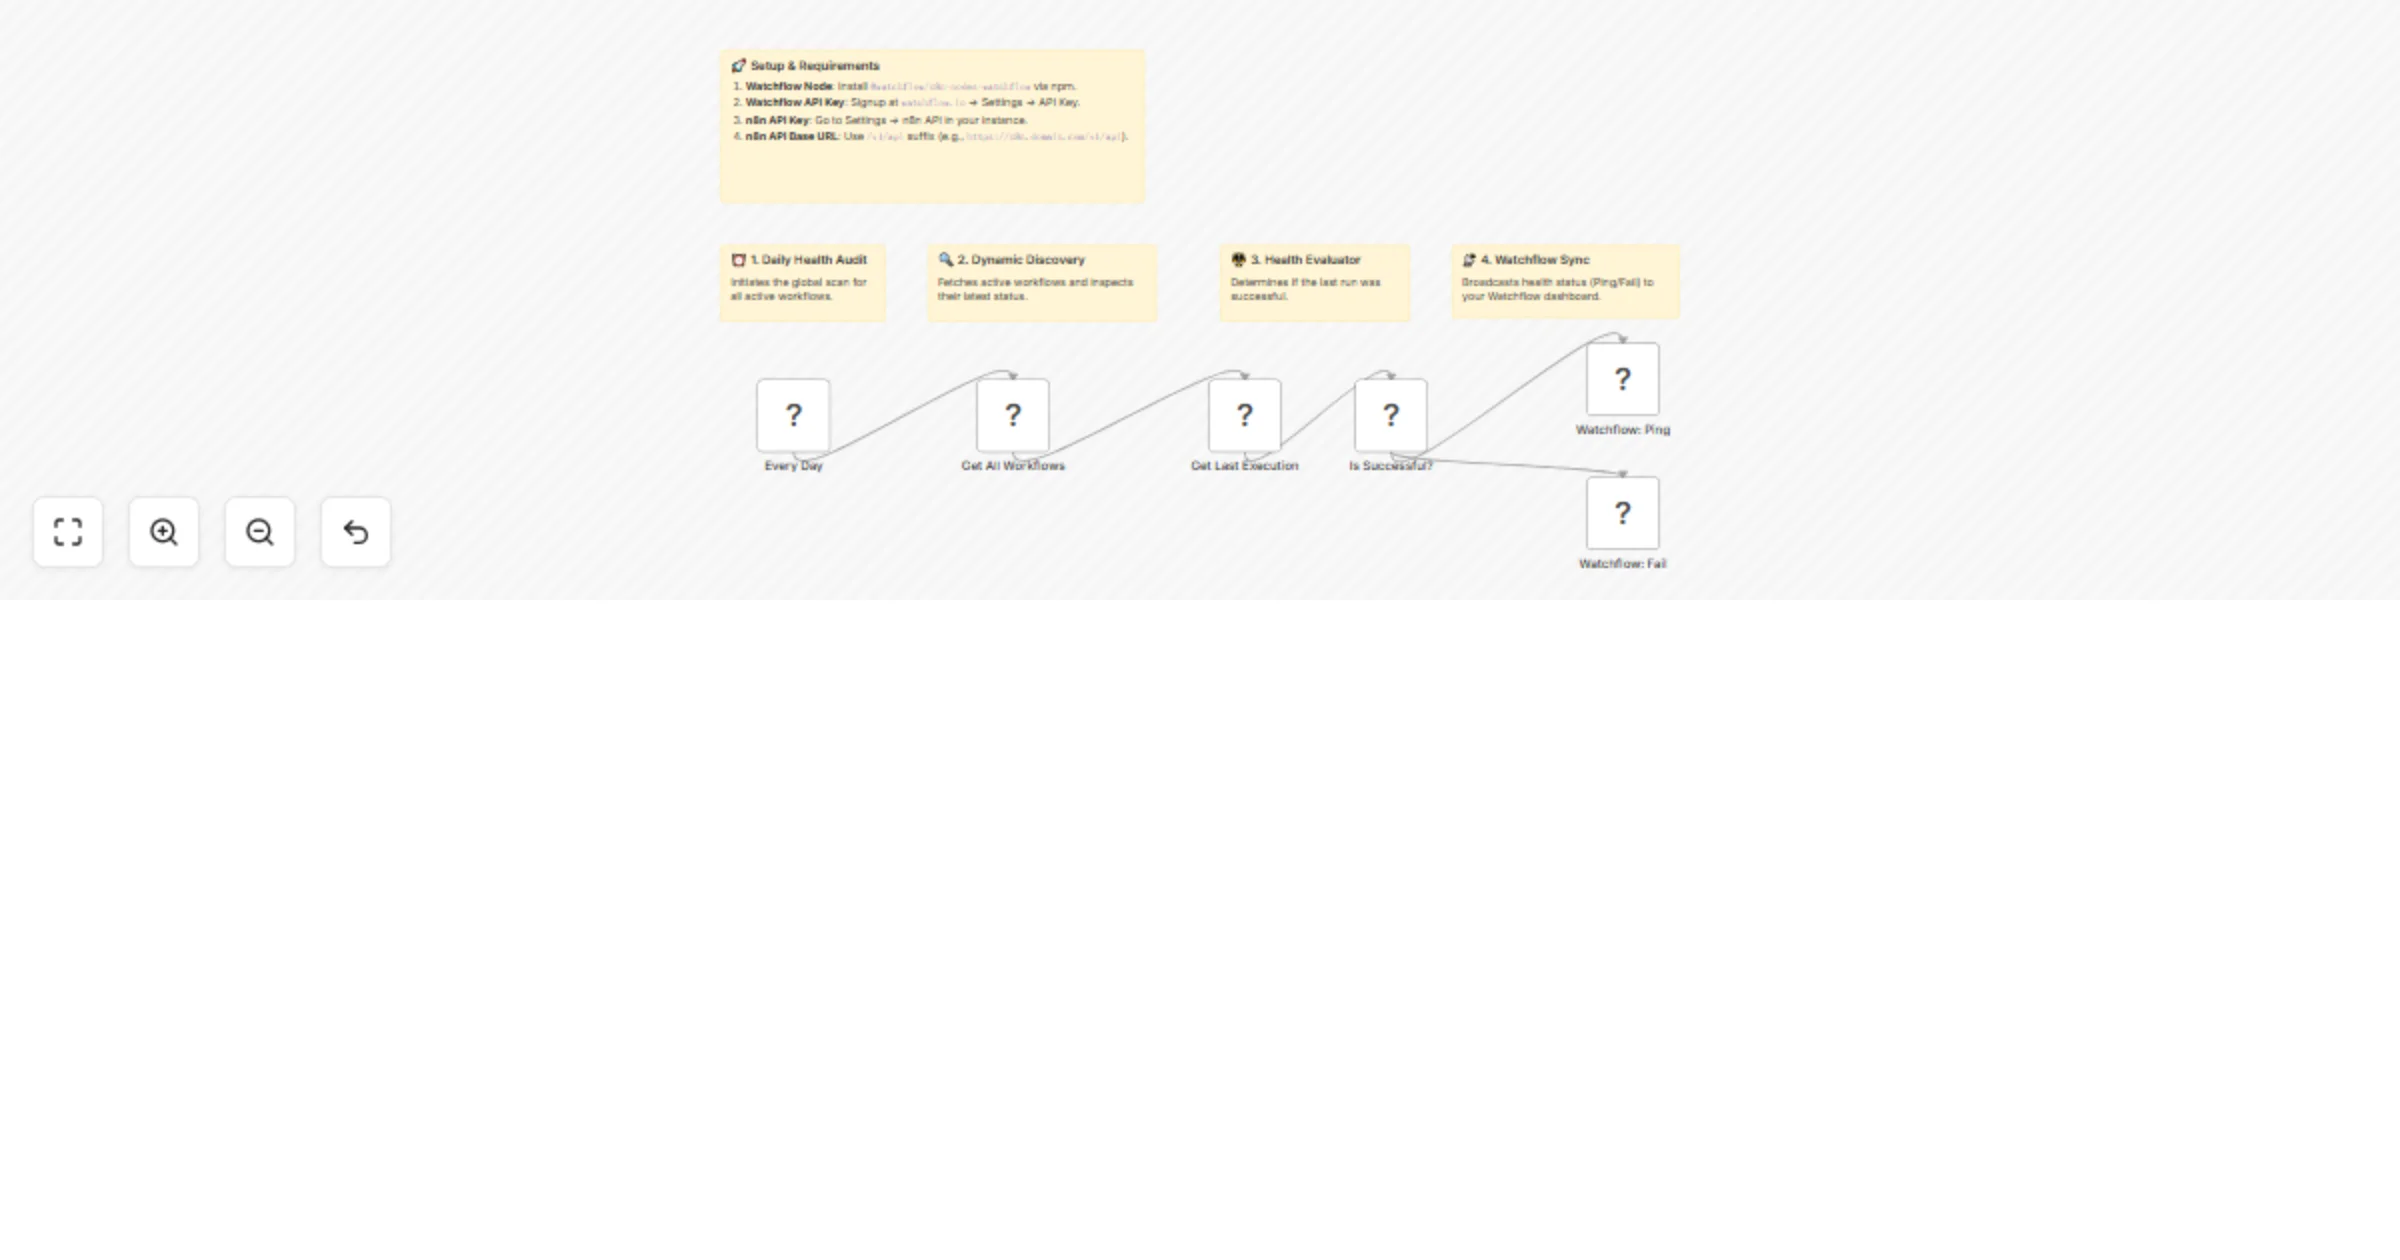
Monitor n8n workflow health daily with Watchflow
🚀 Stop Worrying About n8n Workflow Failures – The Ultimate Global Health Monitor Ever had a critical n8n workflow fa...
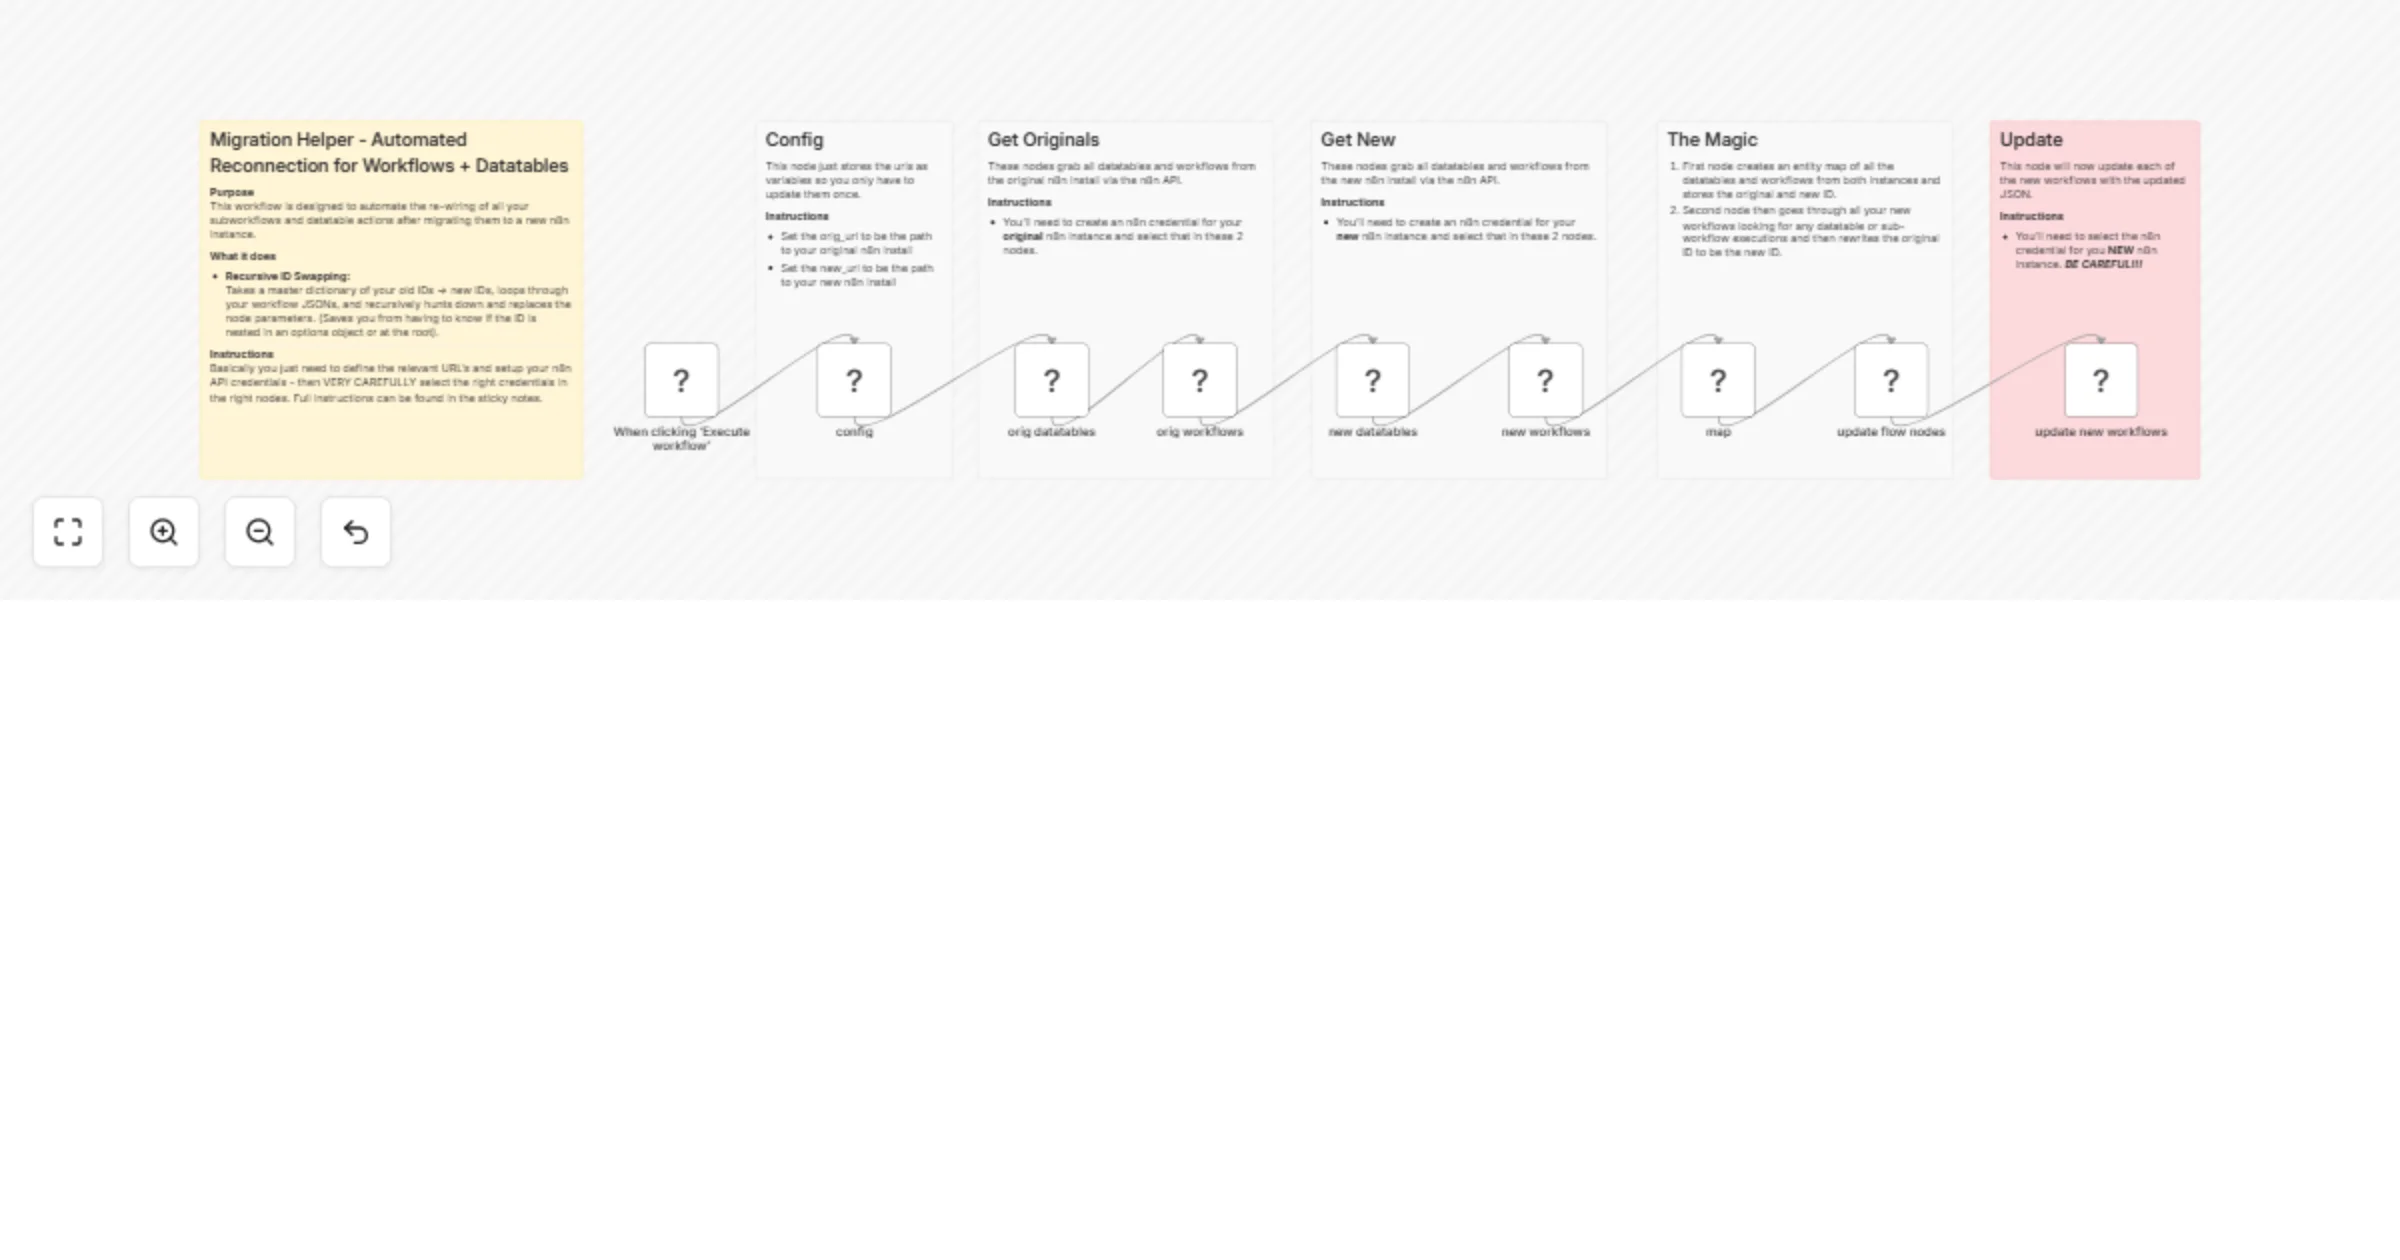
Reconnect migrated workflows and datatables between n8n instances
Purpose This workflow is designed to automate the re wiring of all your subworkflows and datatable actions after migr...
Analyze GitLab CI job failures with GPT-5.3 and send reports to Slack
Overview This workflow helps automatically analyze the causes of build failures in Gitlab CI and propose solutions wi...
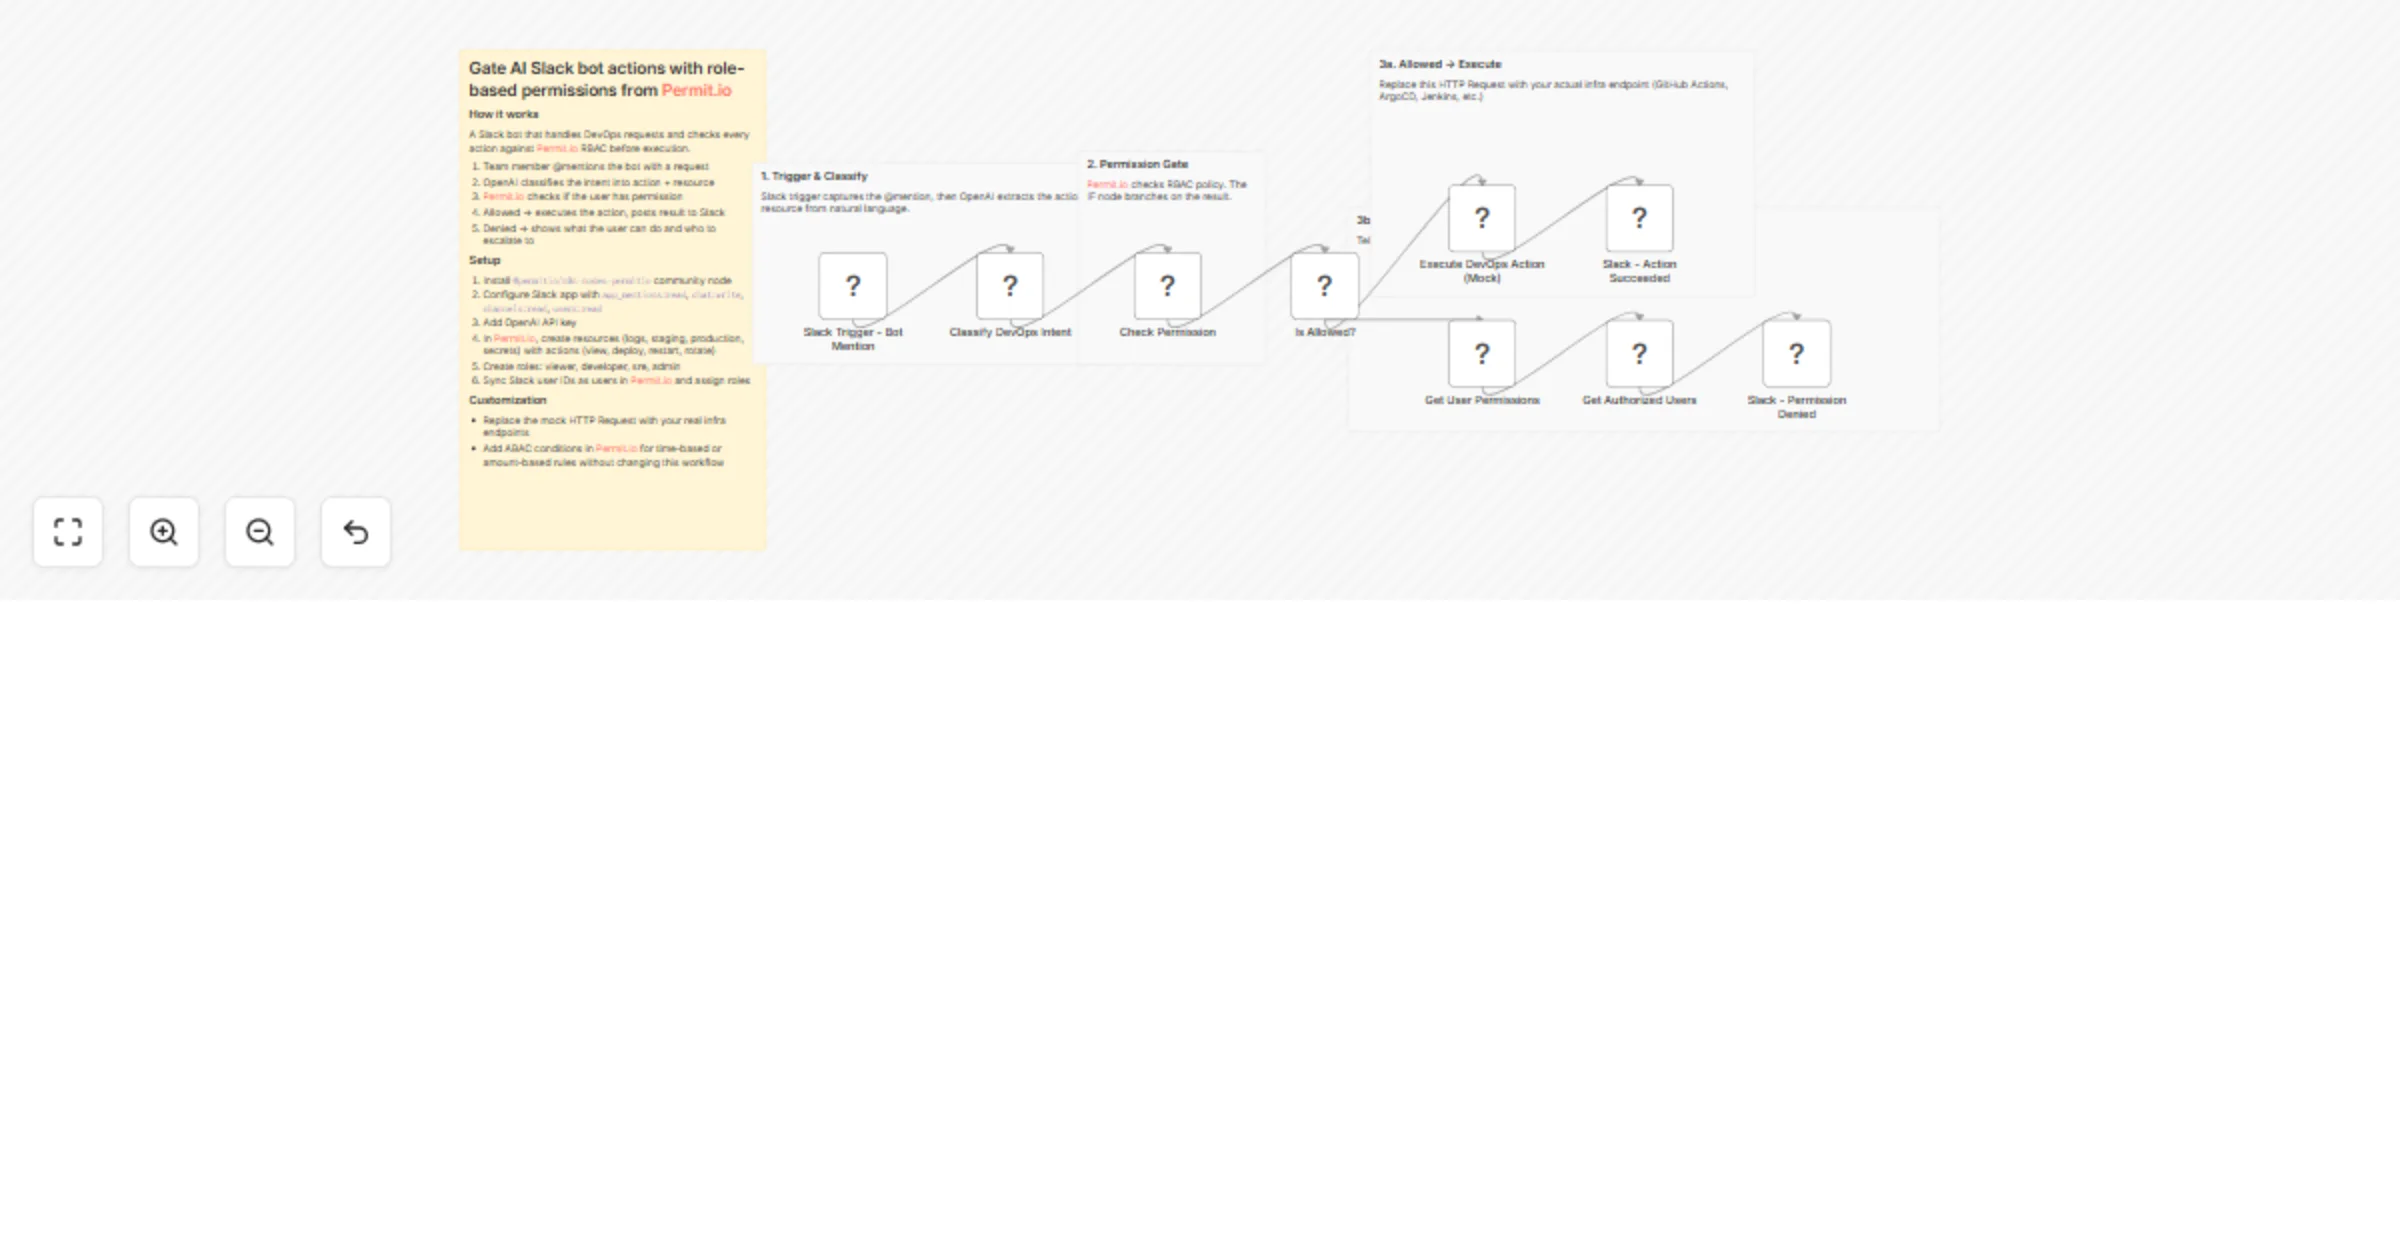
Gate AI Slack DevOps bot actions with OpenAI and Permit.io RBAC
> This n8n workflow template uses a community node and is only compatible with the self hosted version of n8n. Who...
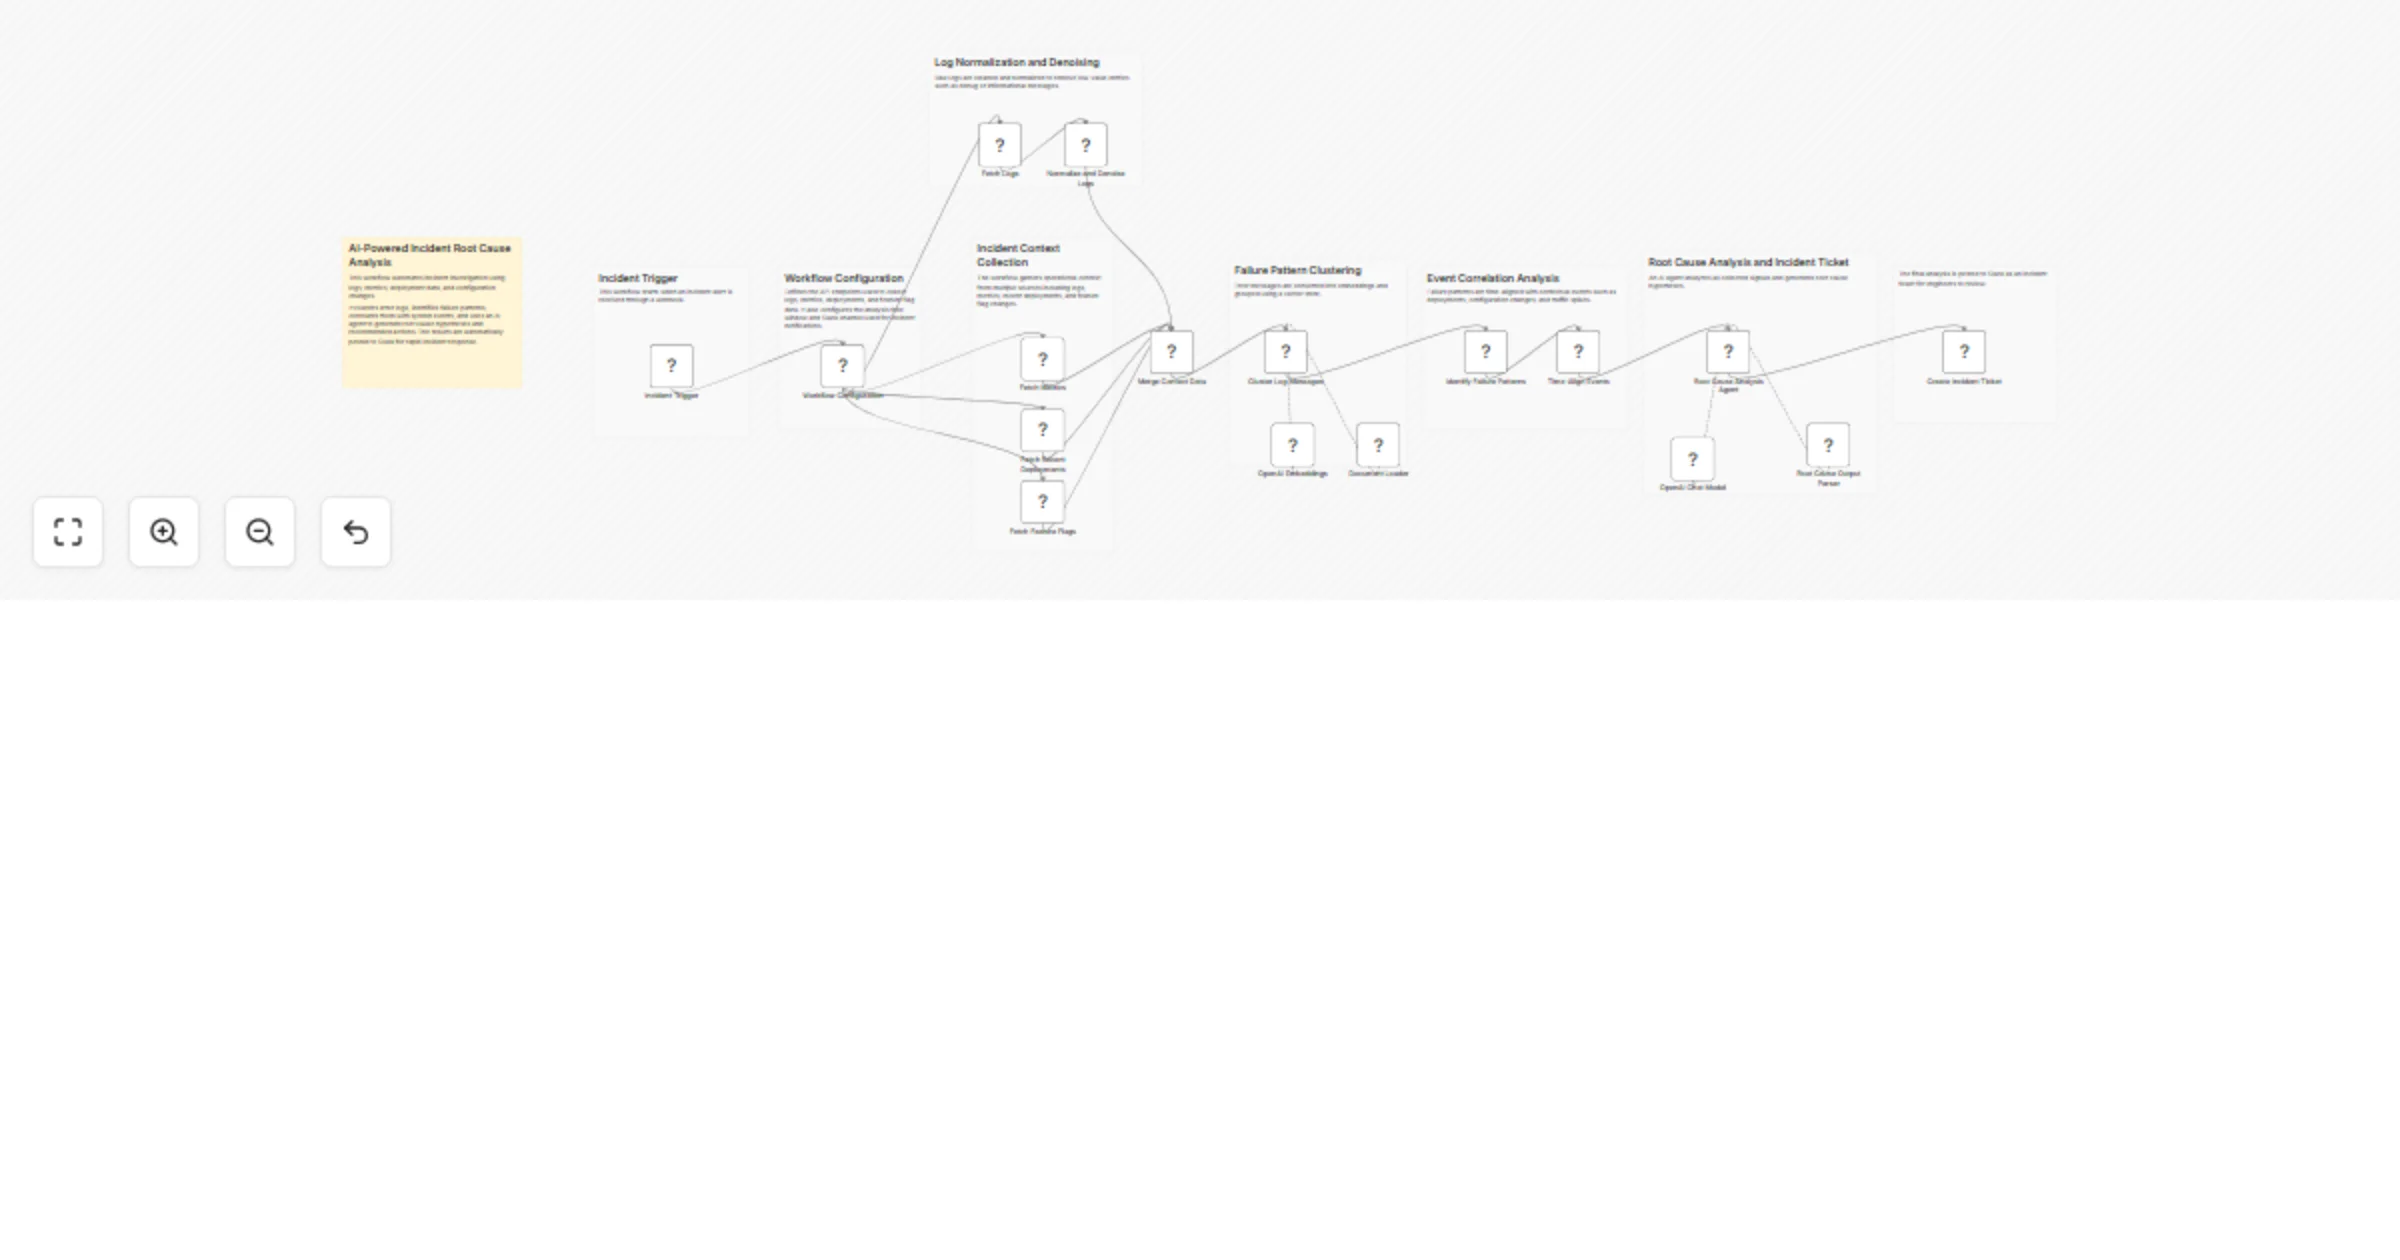
Analyze logs and correlate incidents with OpenAI and Slack
Overview This workflow implements an AI powered incident investigation and root cause analysis system that automatica...
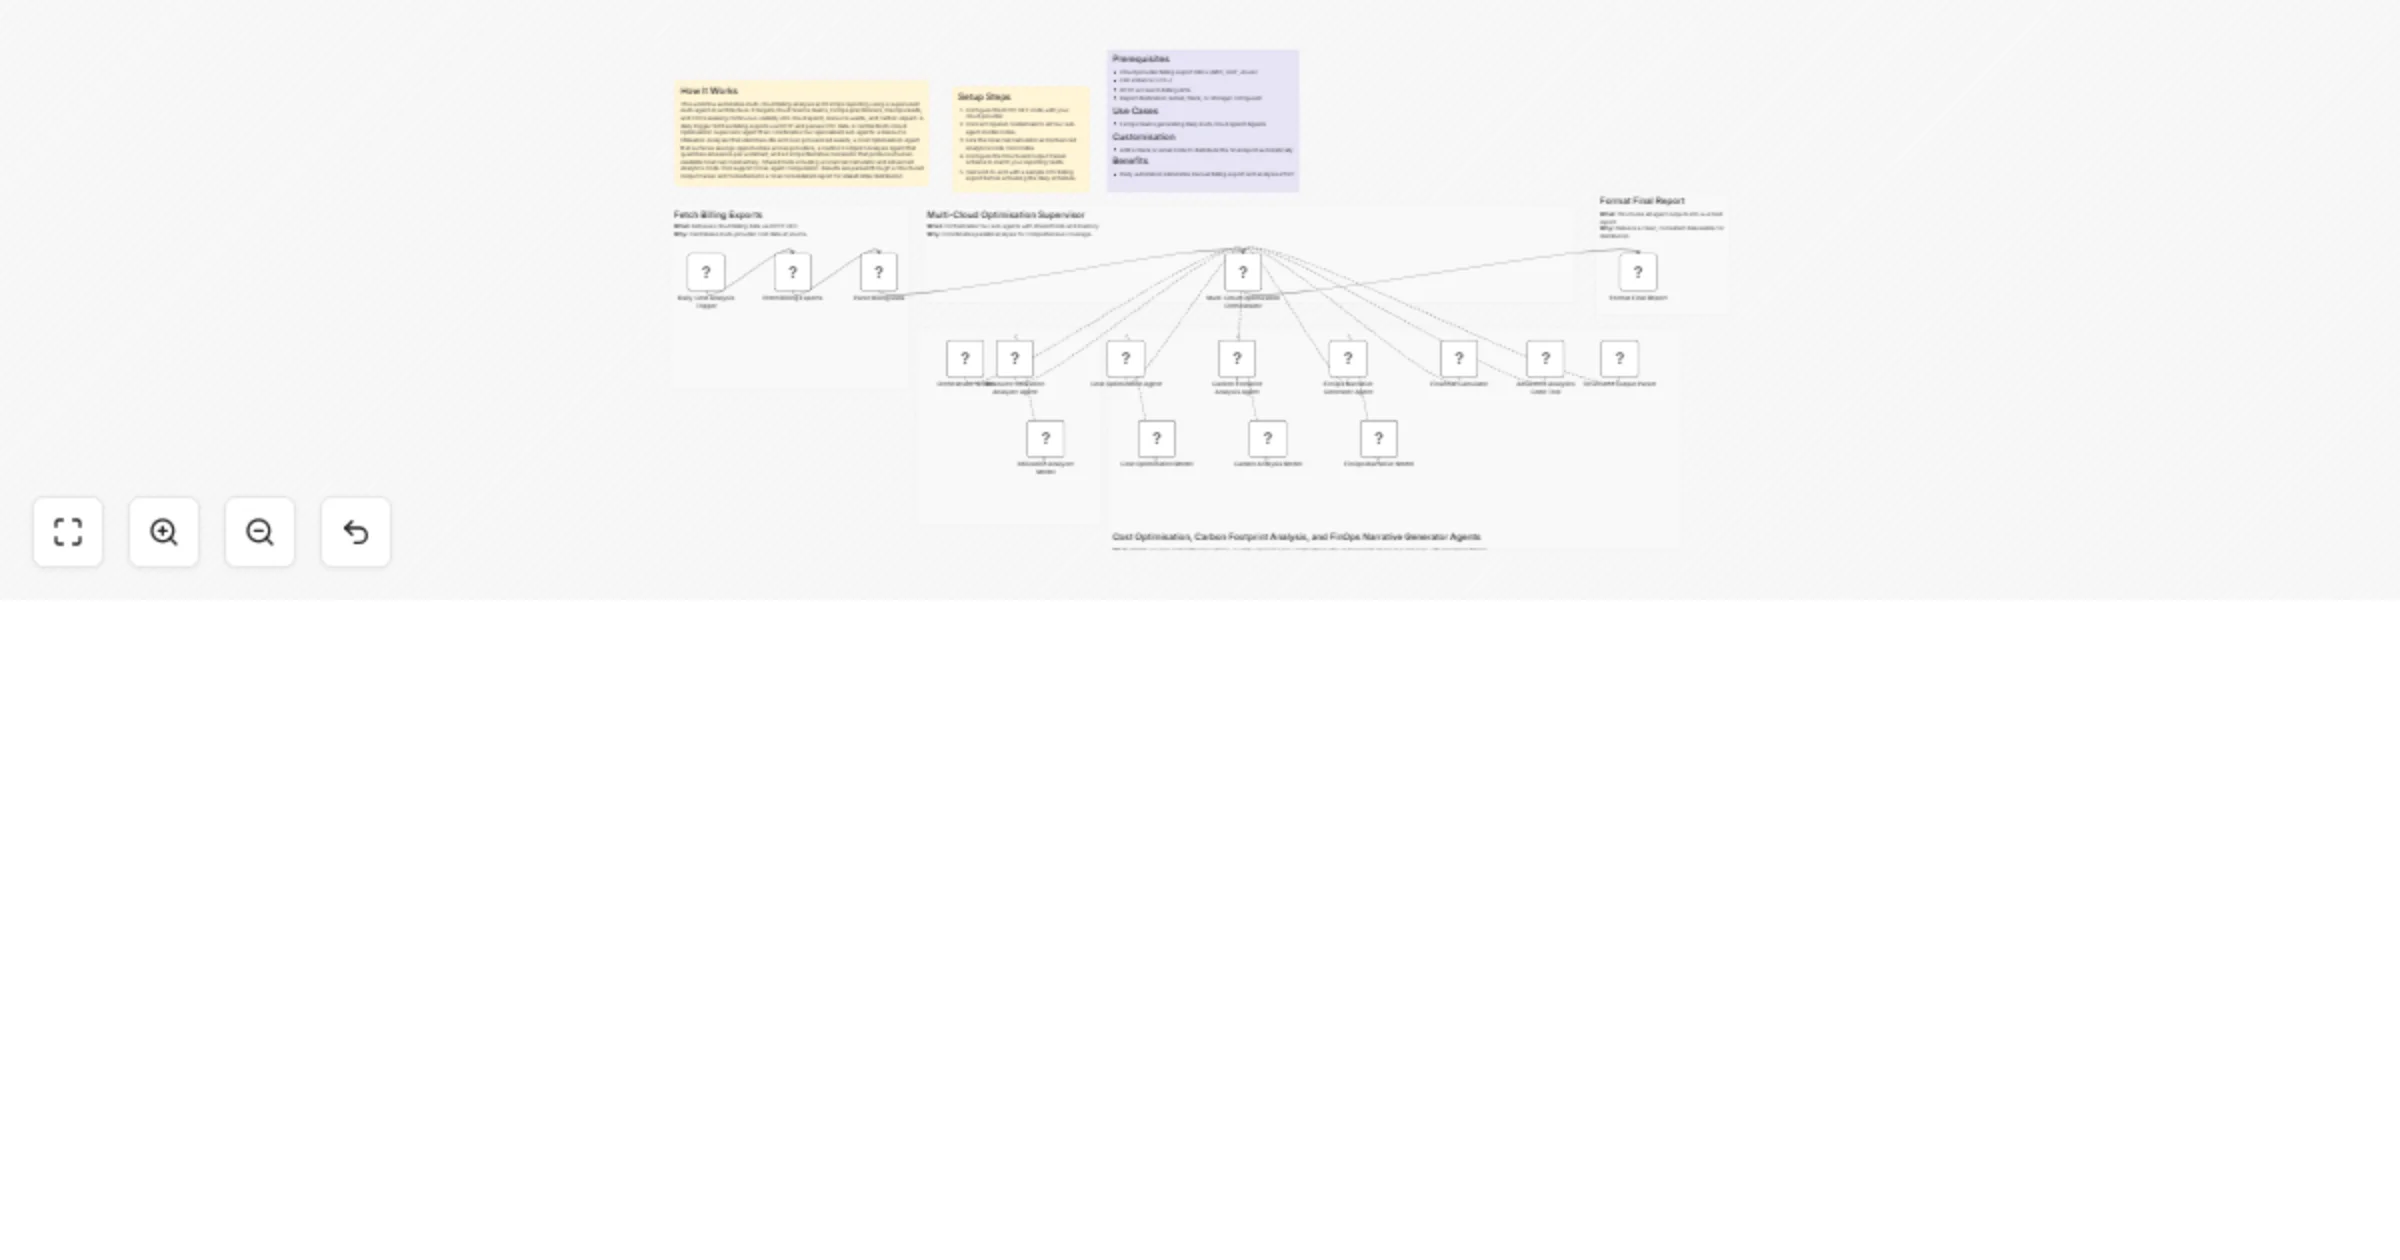
Generate daily multi-cloud FinOps cost and carbon reports with OpenAI GPT-4o
How It Works This workflow automates multi cloud billing analysis and FinOps reporting using a supervised multi agent...
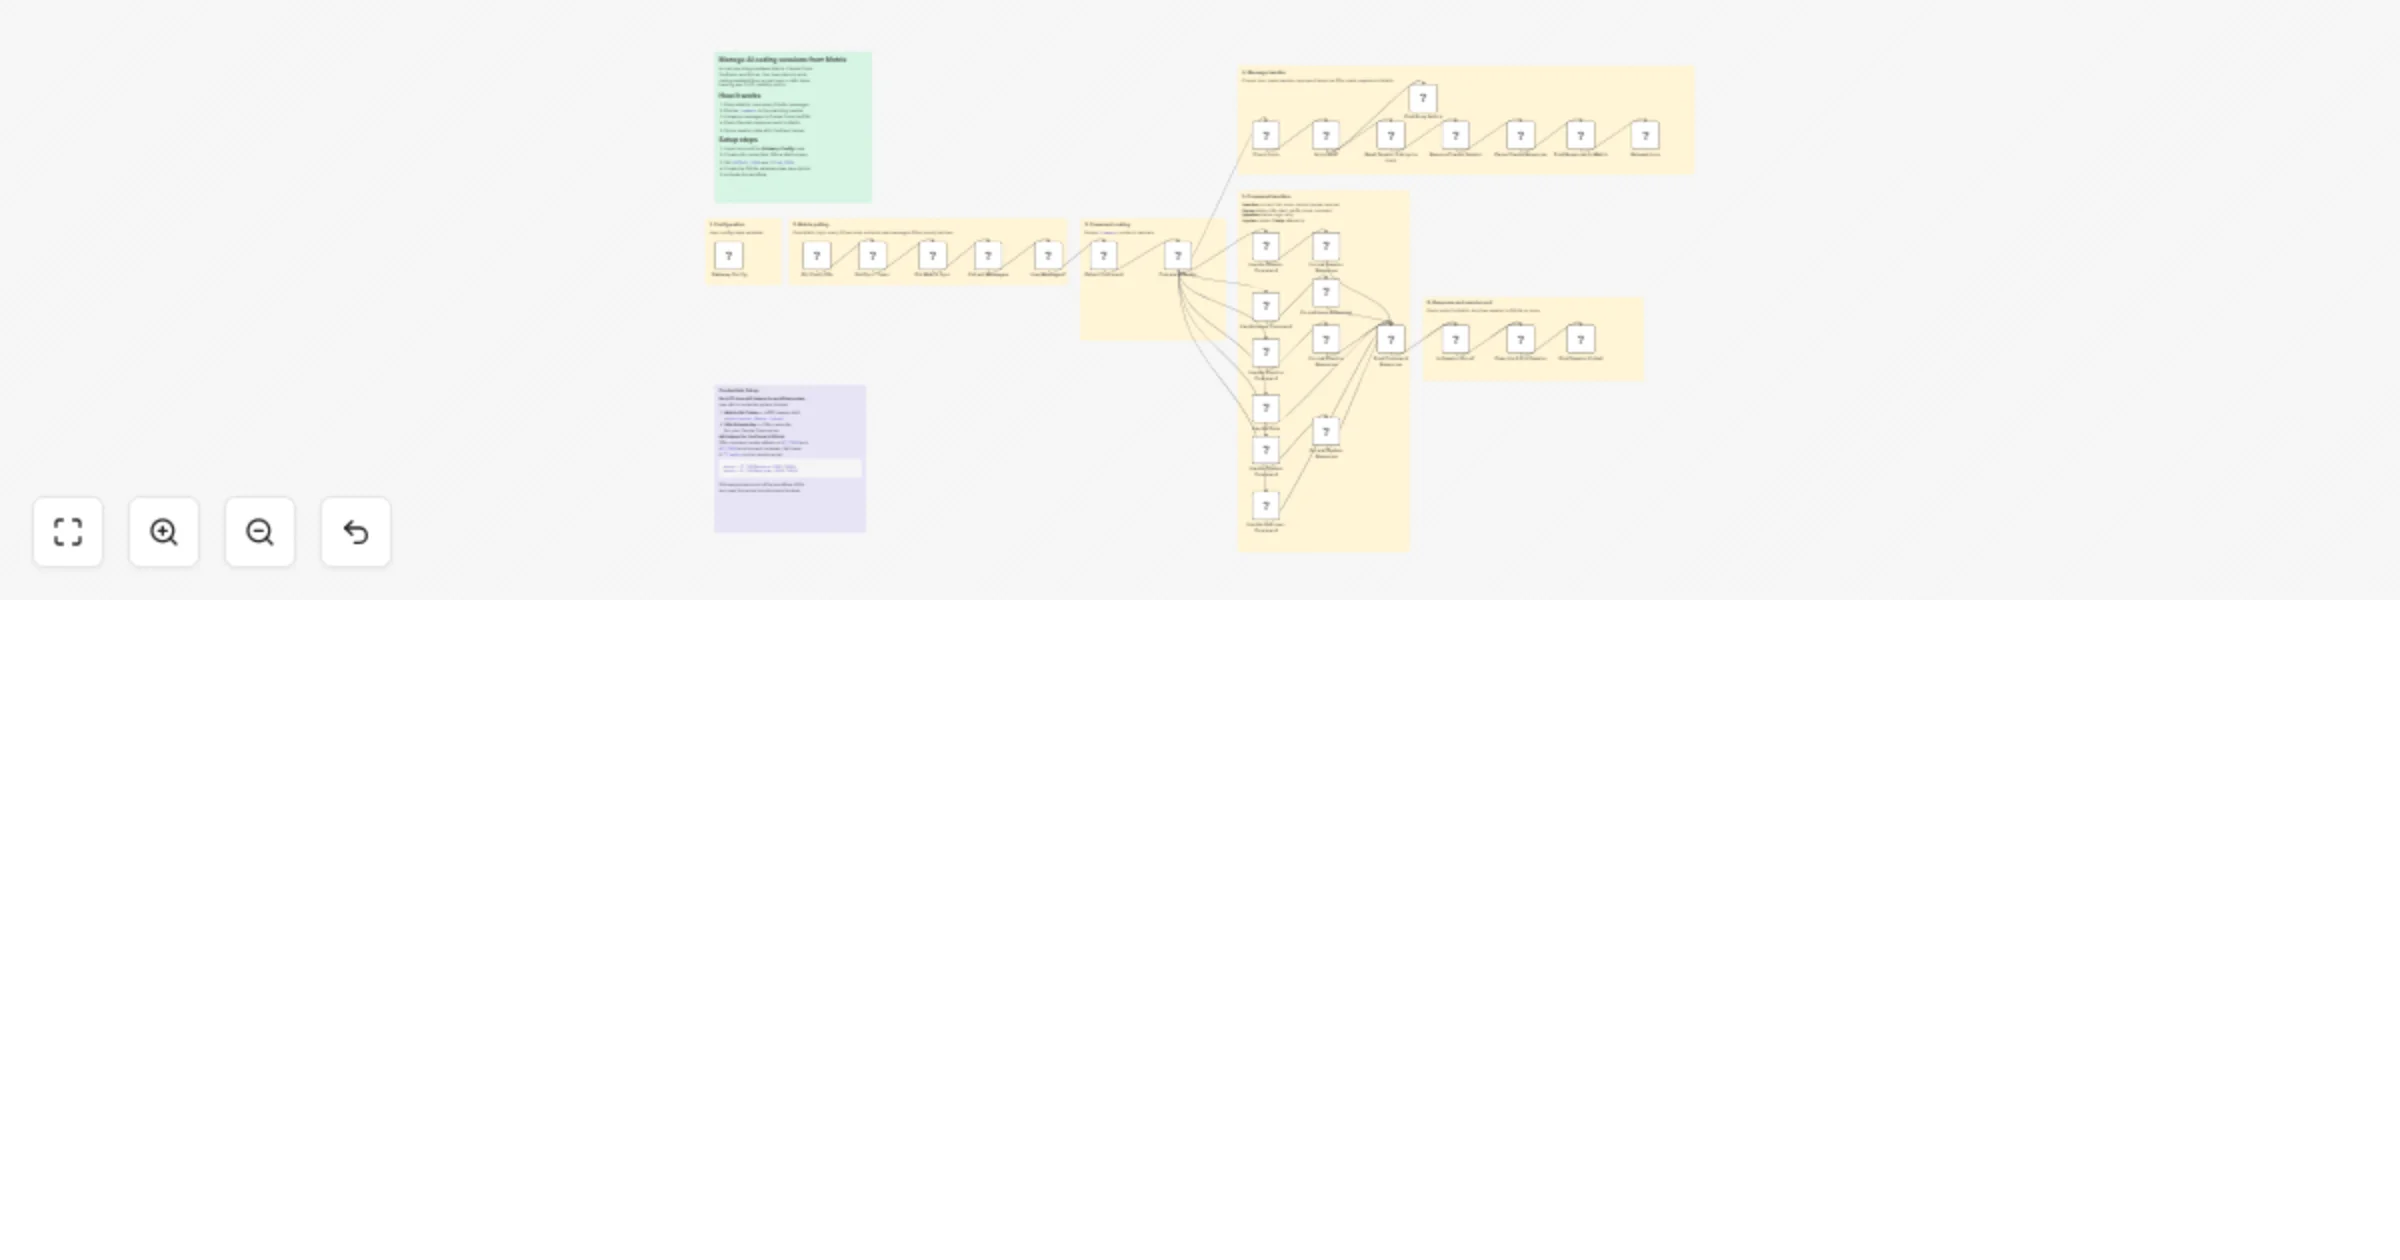
Manage Claude Code sessions from Matrix with YouTrack and GitLab
Manage AI coding sessions from Matrix with YouTrack and GitLab Who is this for Development teams using Claude Code wh...
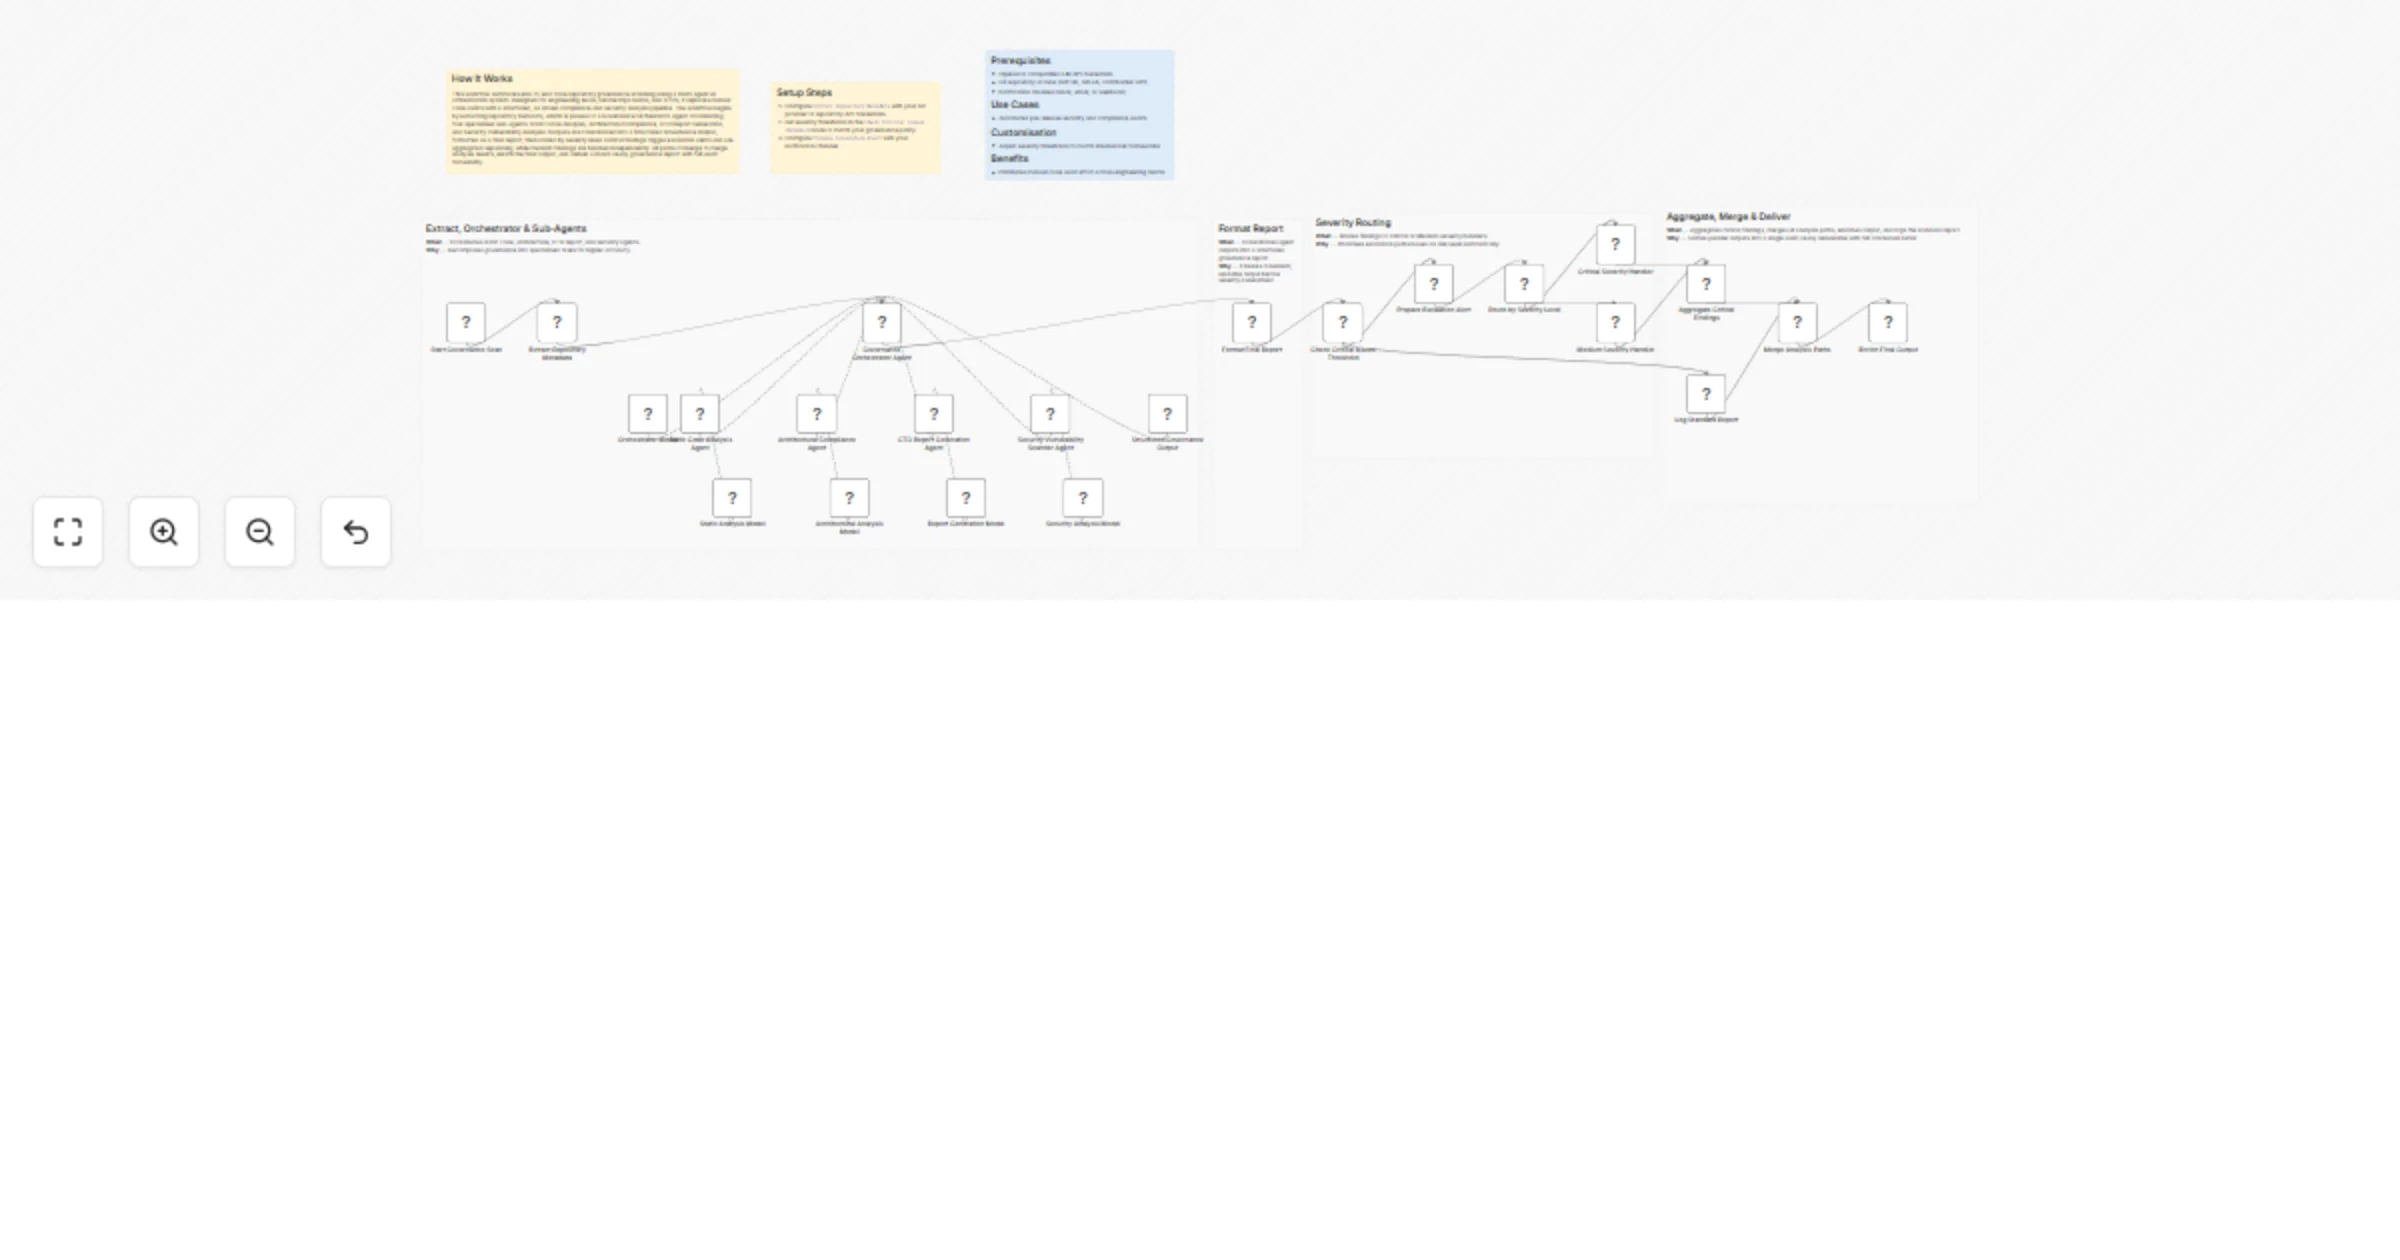
Scan code repositories for governance issues with GPT-4o and severity-based reports
How It Works This workflow automates end to end code repository governance scanning using a multi agent AI orchestrat...
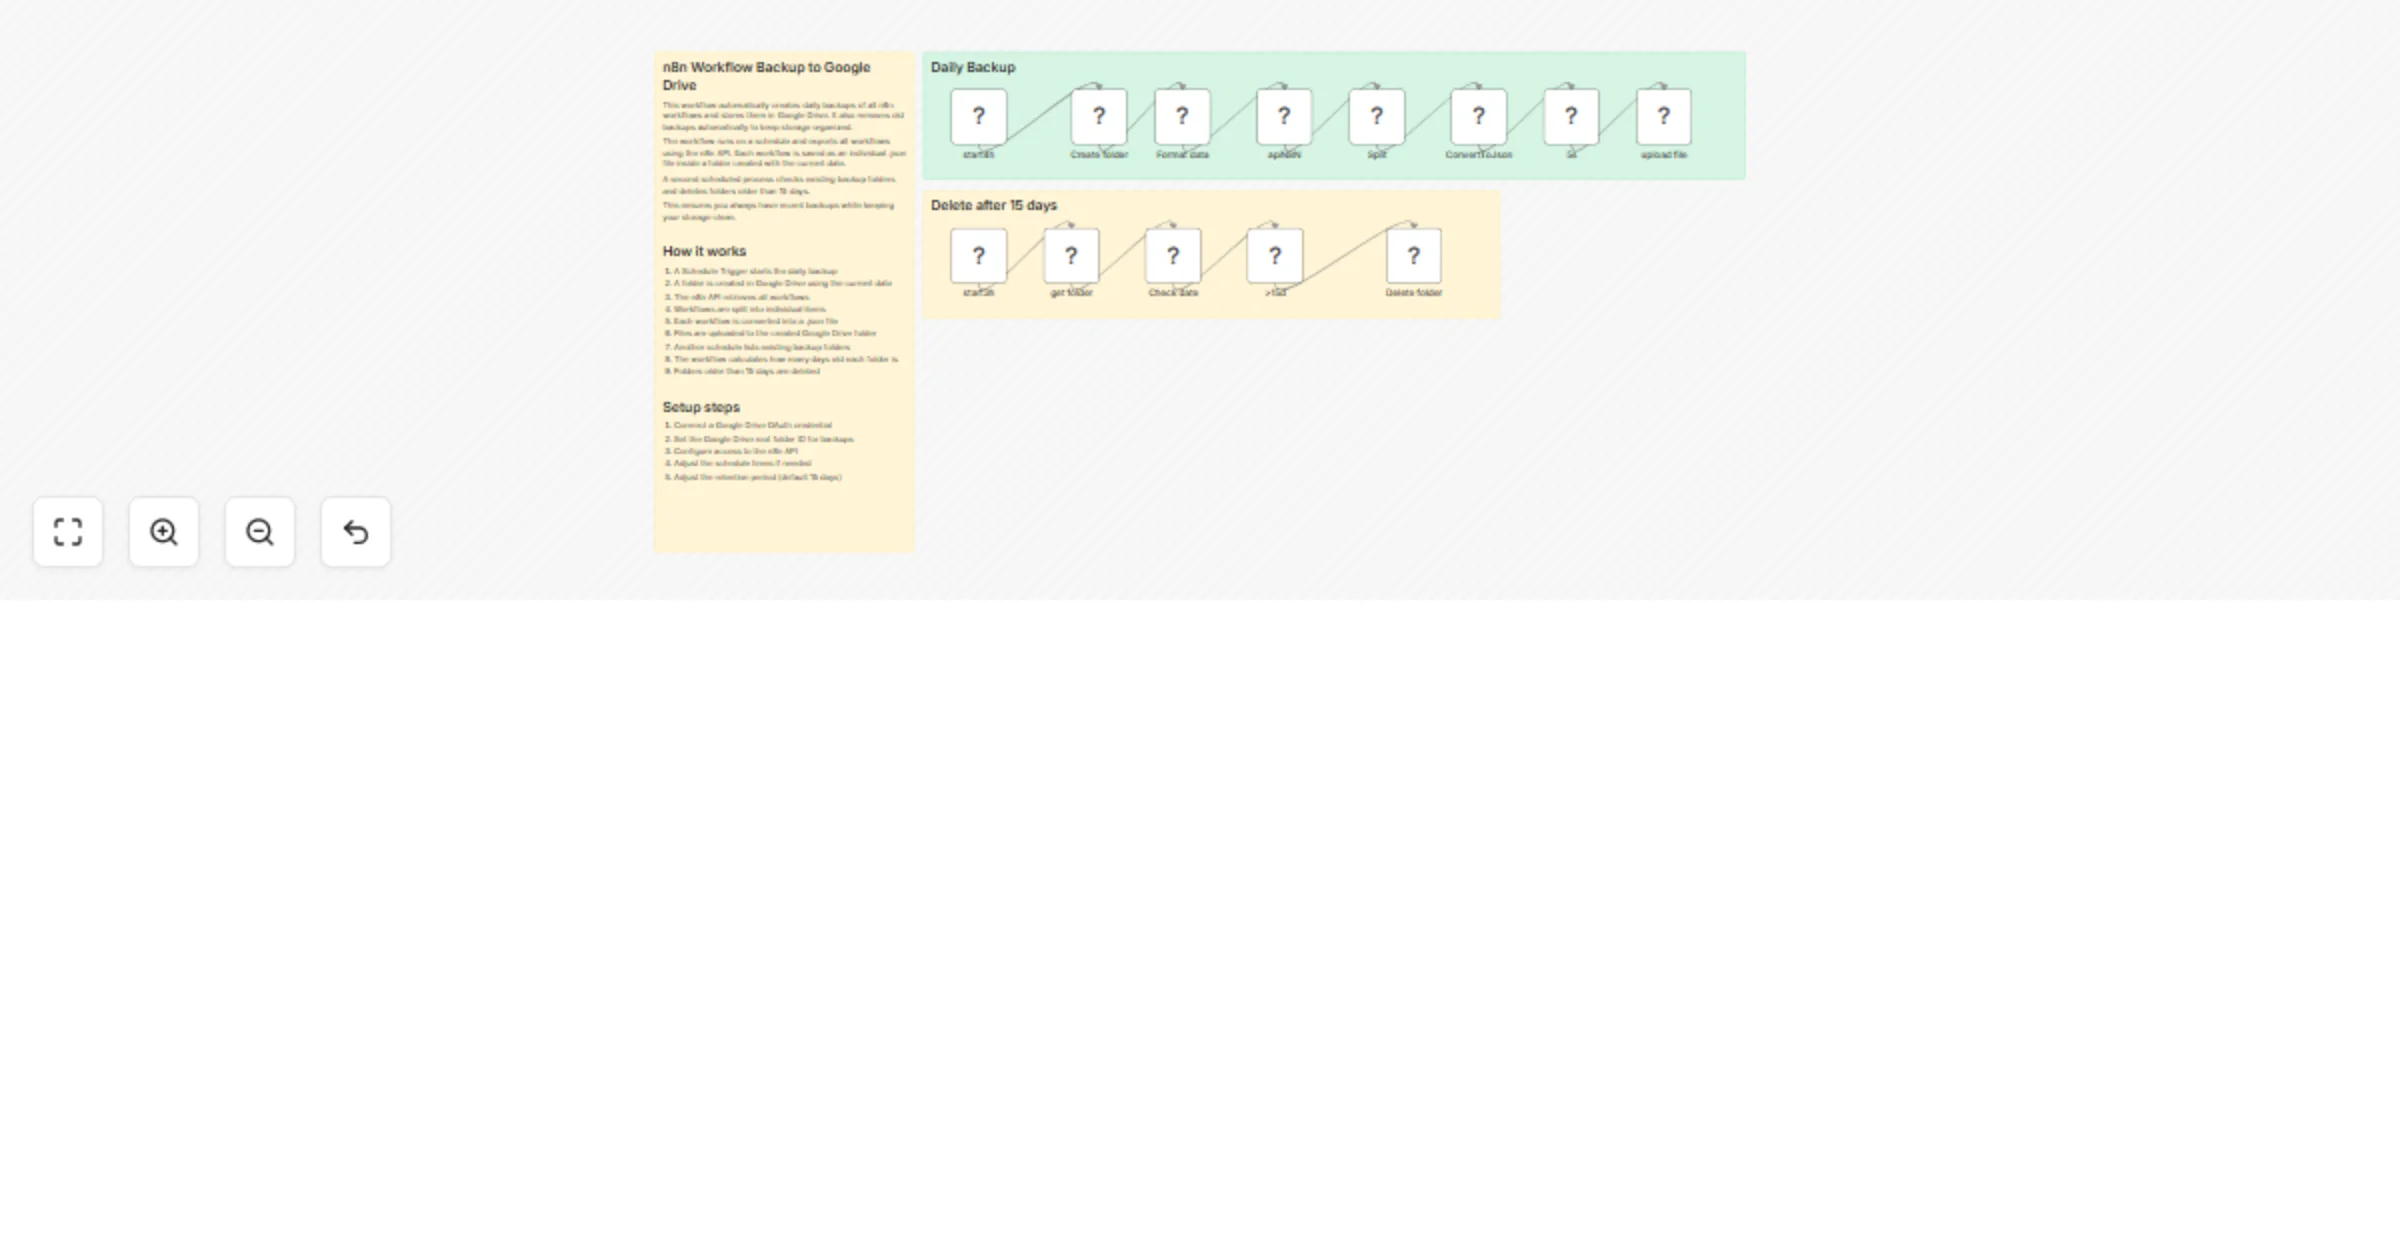
Back up workflows to Google Drive daily with automatic cleanup
This workflow automatically creates daily backups of all n8n workflows and stores them in Google Drive, using the n8n...
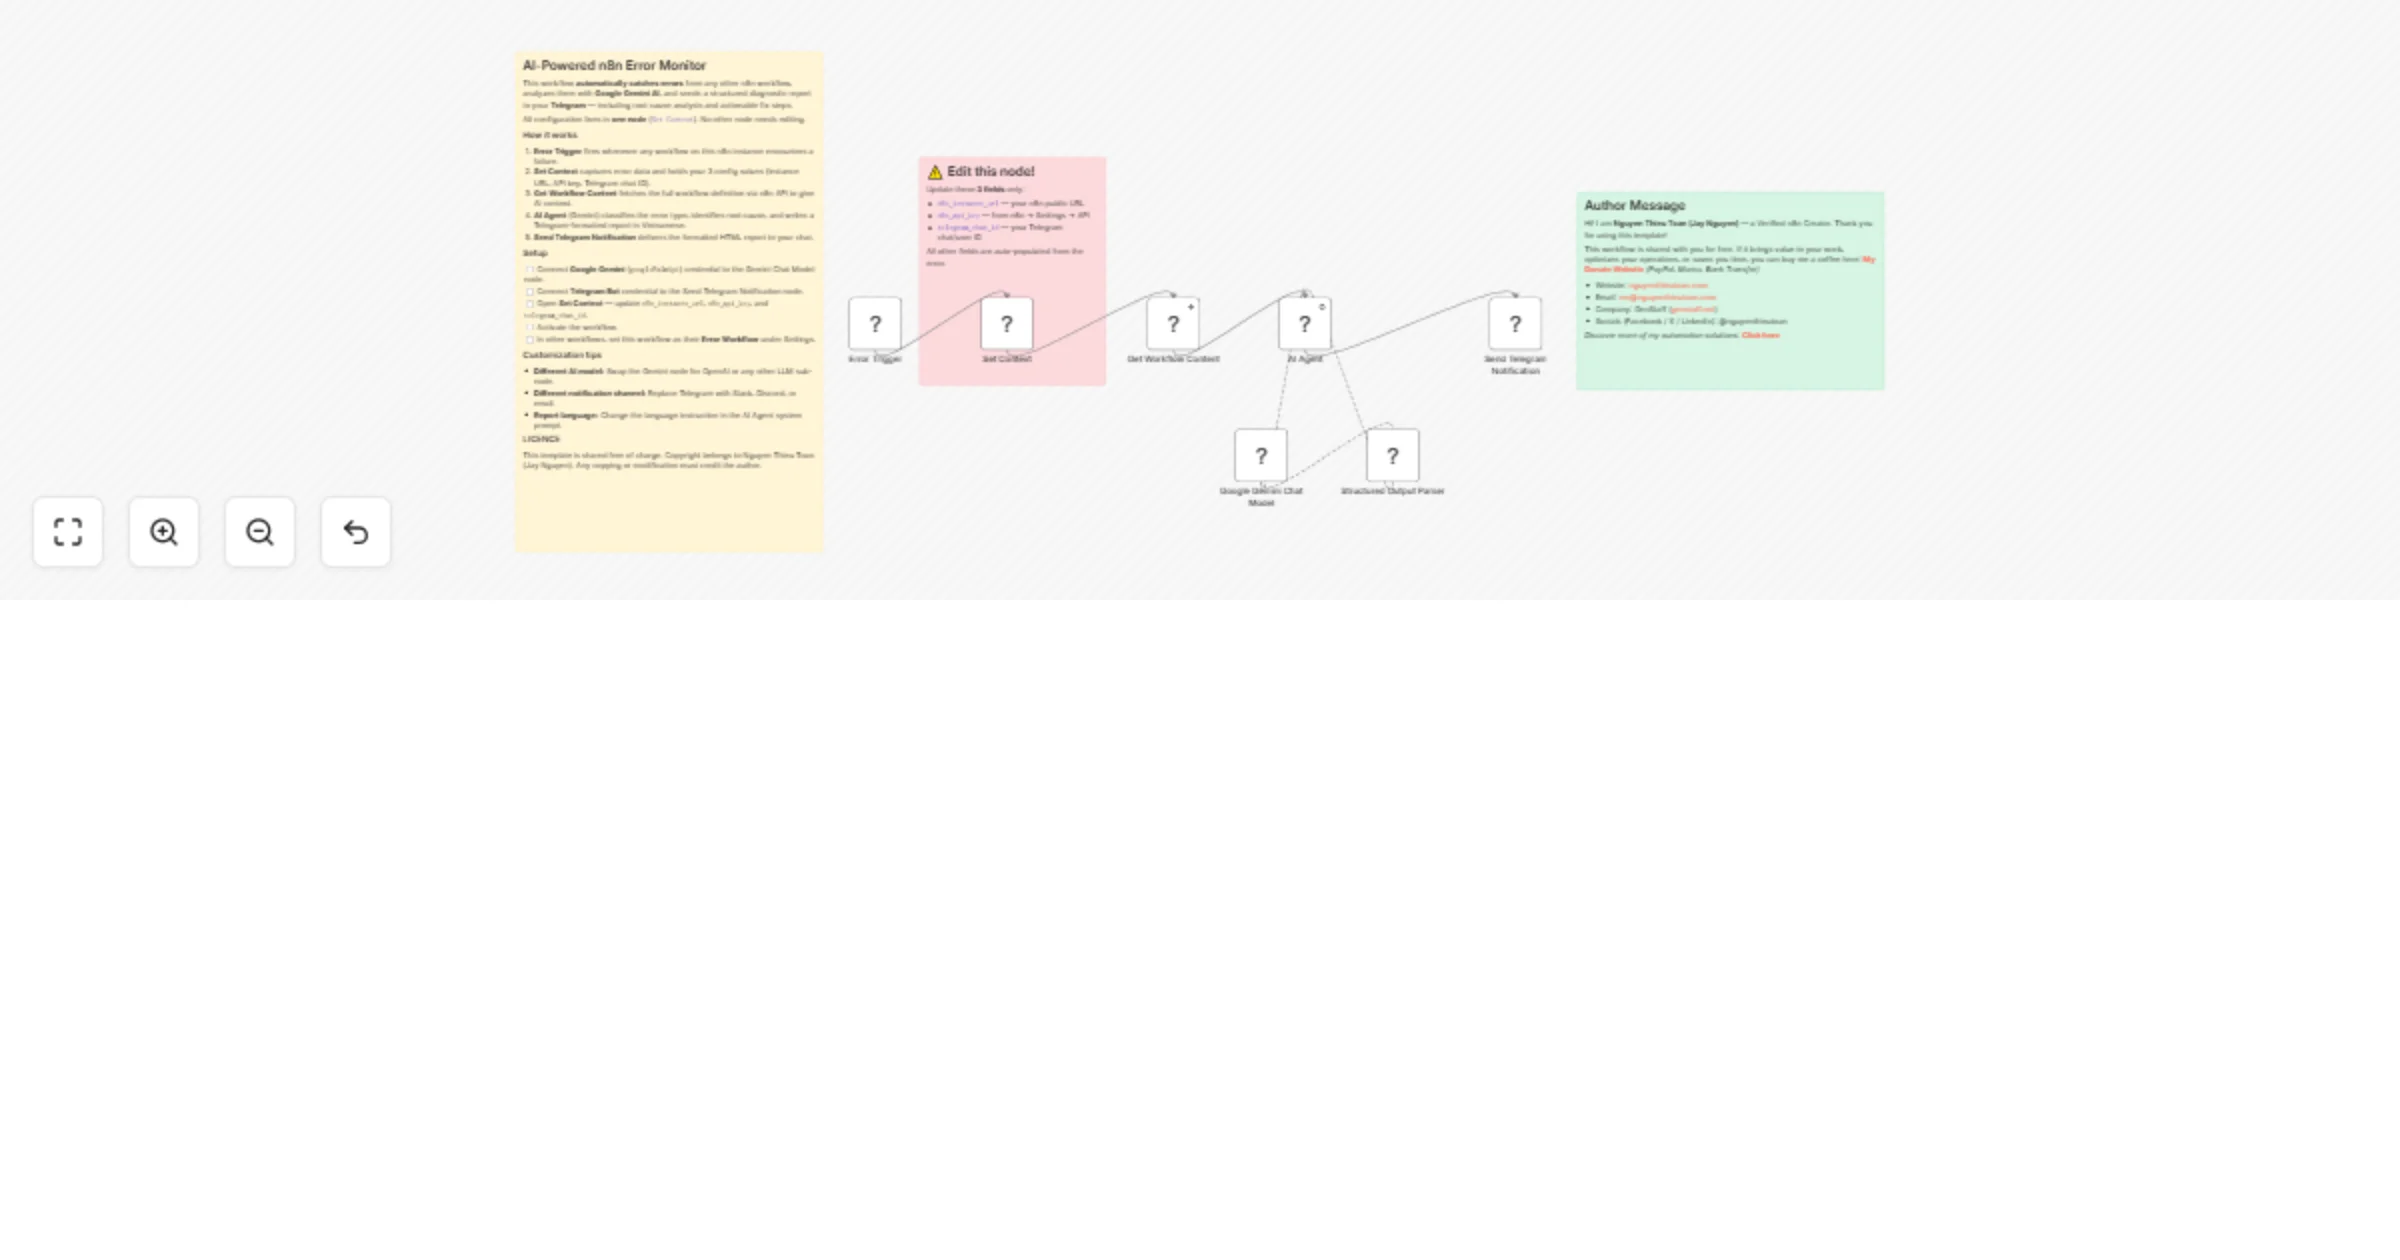
Monitor workflow errors via n8n API with Gemini analysis and Telegram alerts
Monitor n8n Workflow Errors with AI Diagnosis & Instant Telegram Alerts This n8n template automatically catches error...
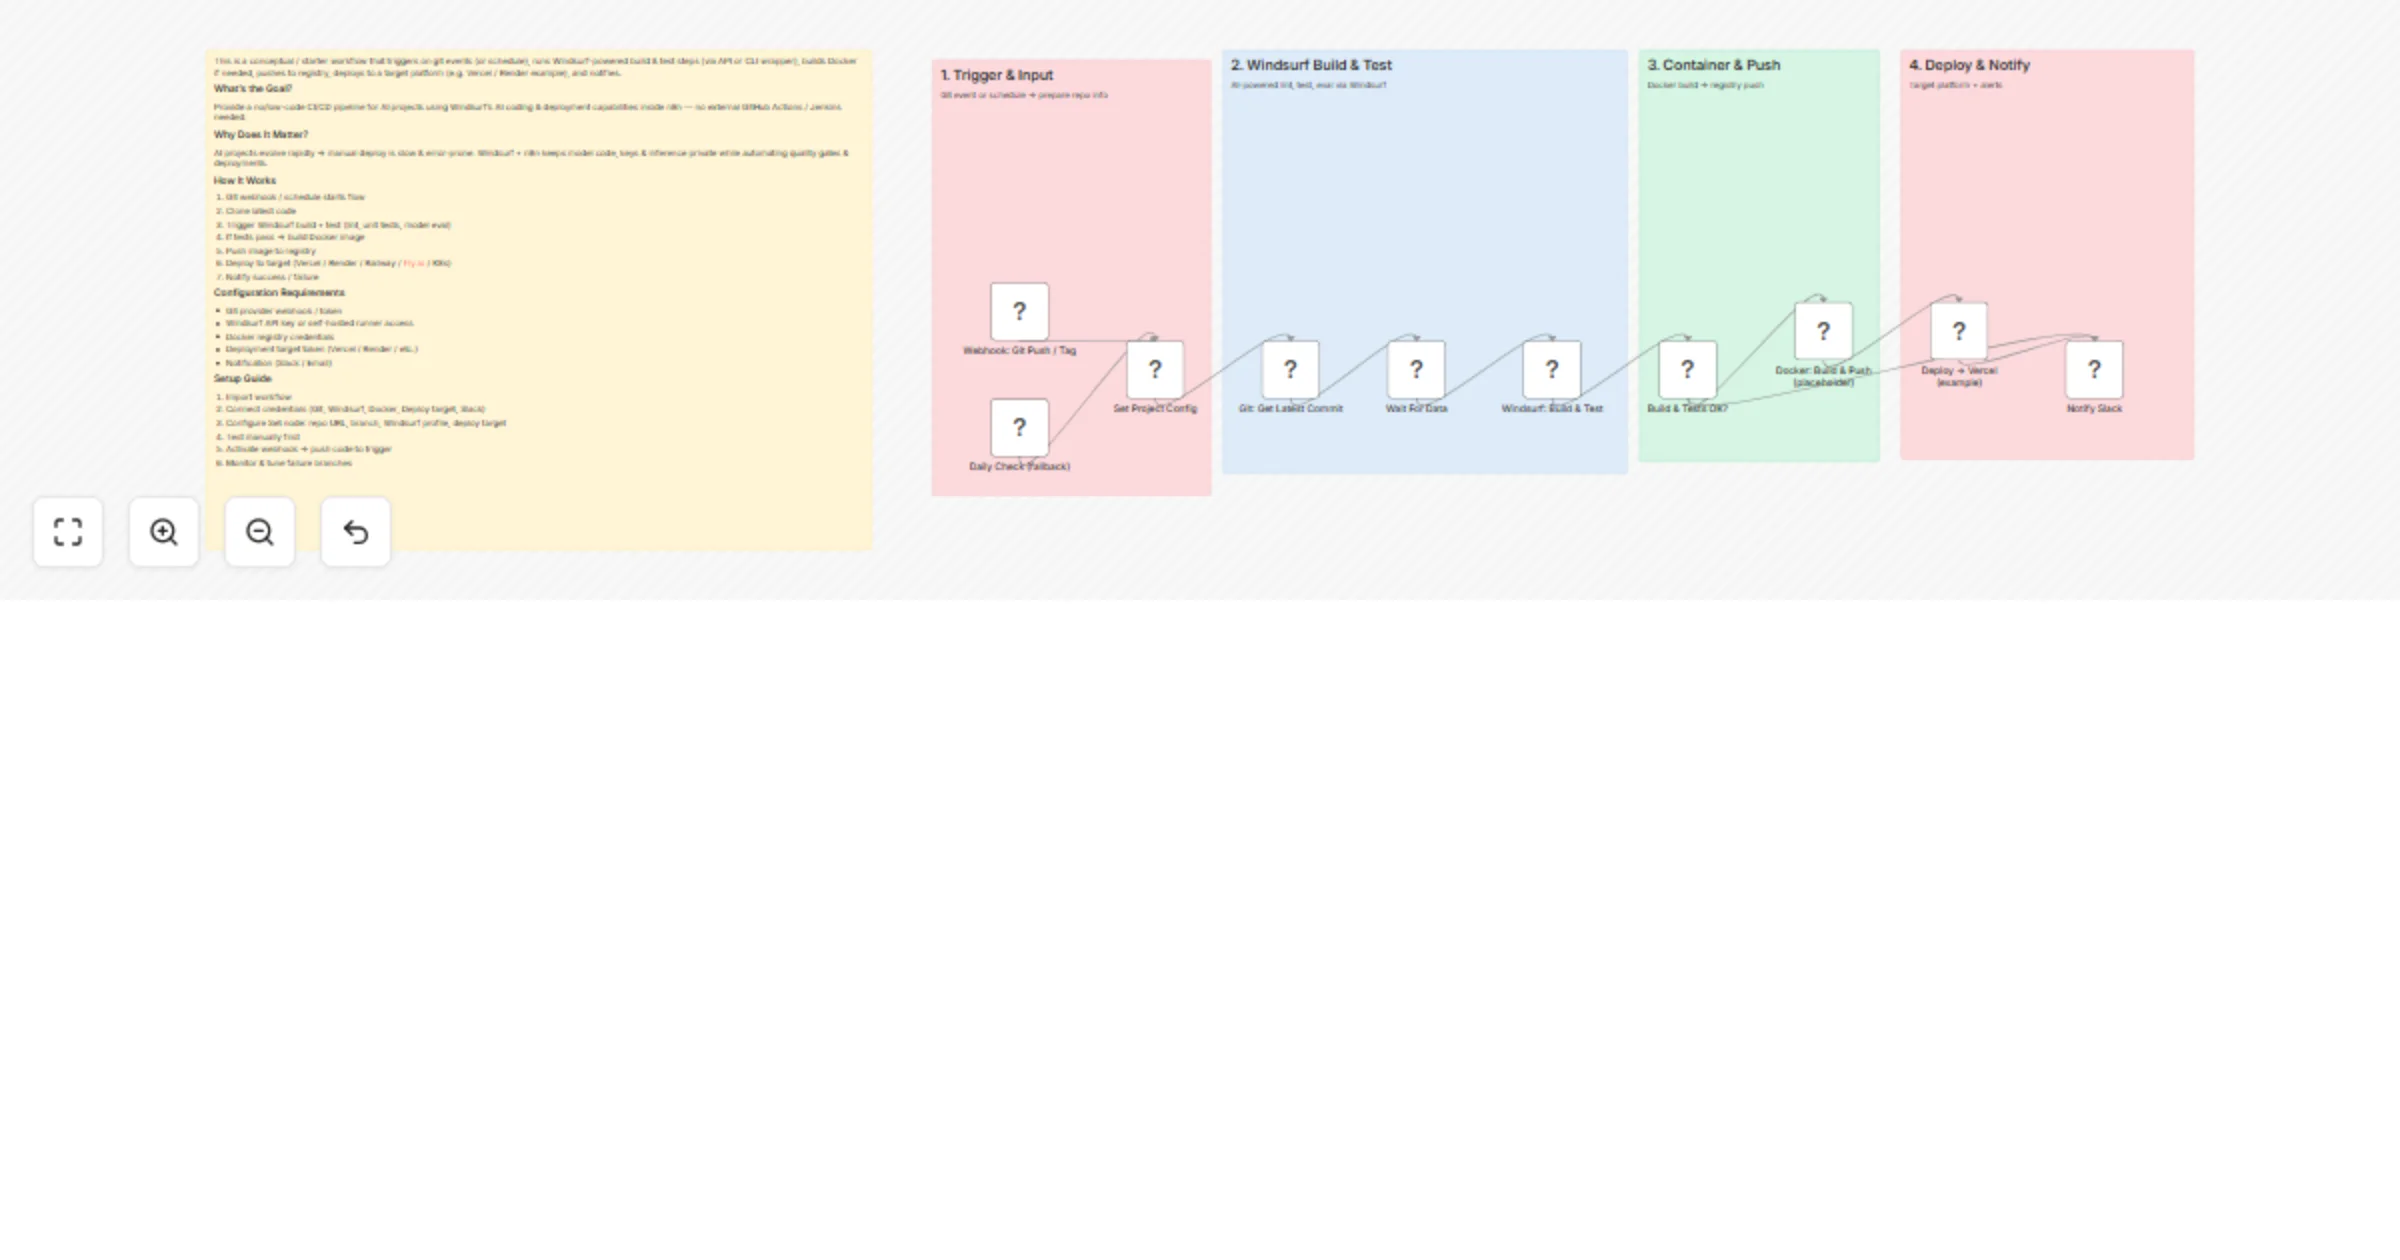
Build, test and deploy AI projects with Windsurf CI/CD and Vercel
This is a conceptual / starter workflow that triggers on git events (or schedule), runs Windsurf powered build & test...
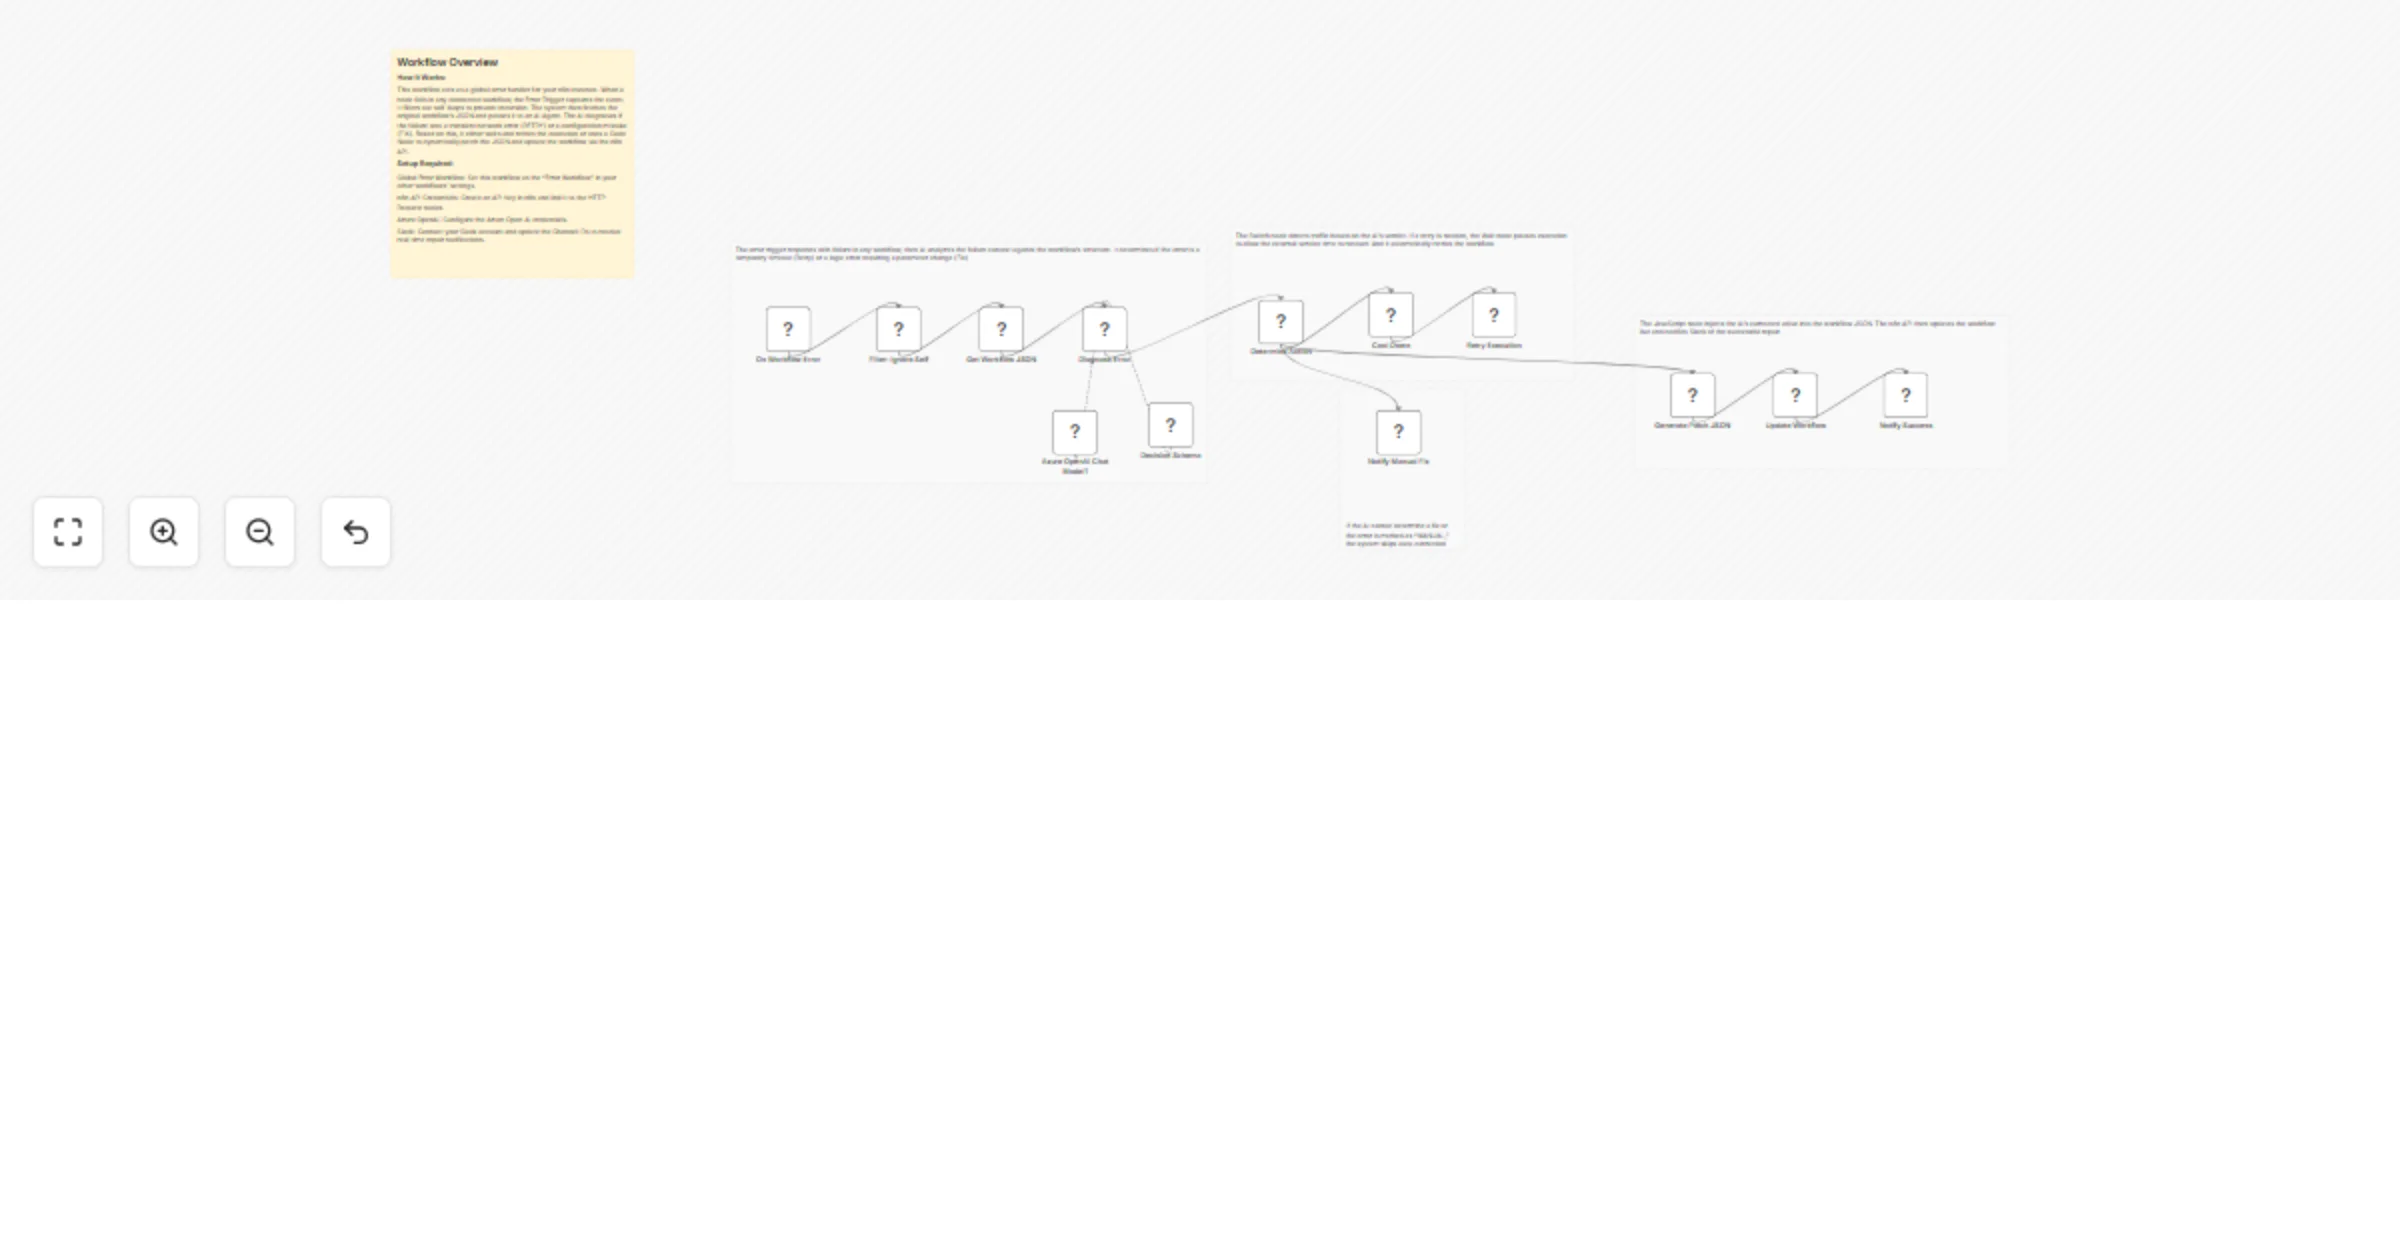
Auto-heal failing workflows with Azure OpenAI, n8n API, and Slack alerts
📊 Description Eliminate manual troubleshooting with an AI powered autonomous recovery engine for n8n 🤖. This system...
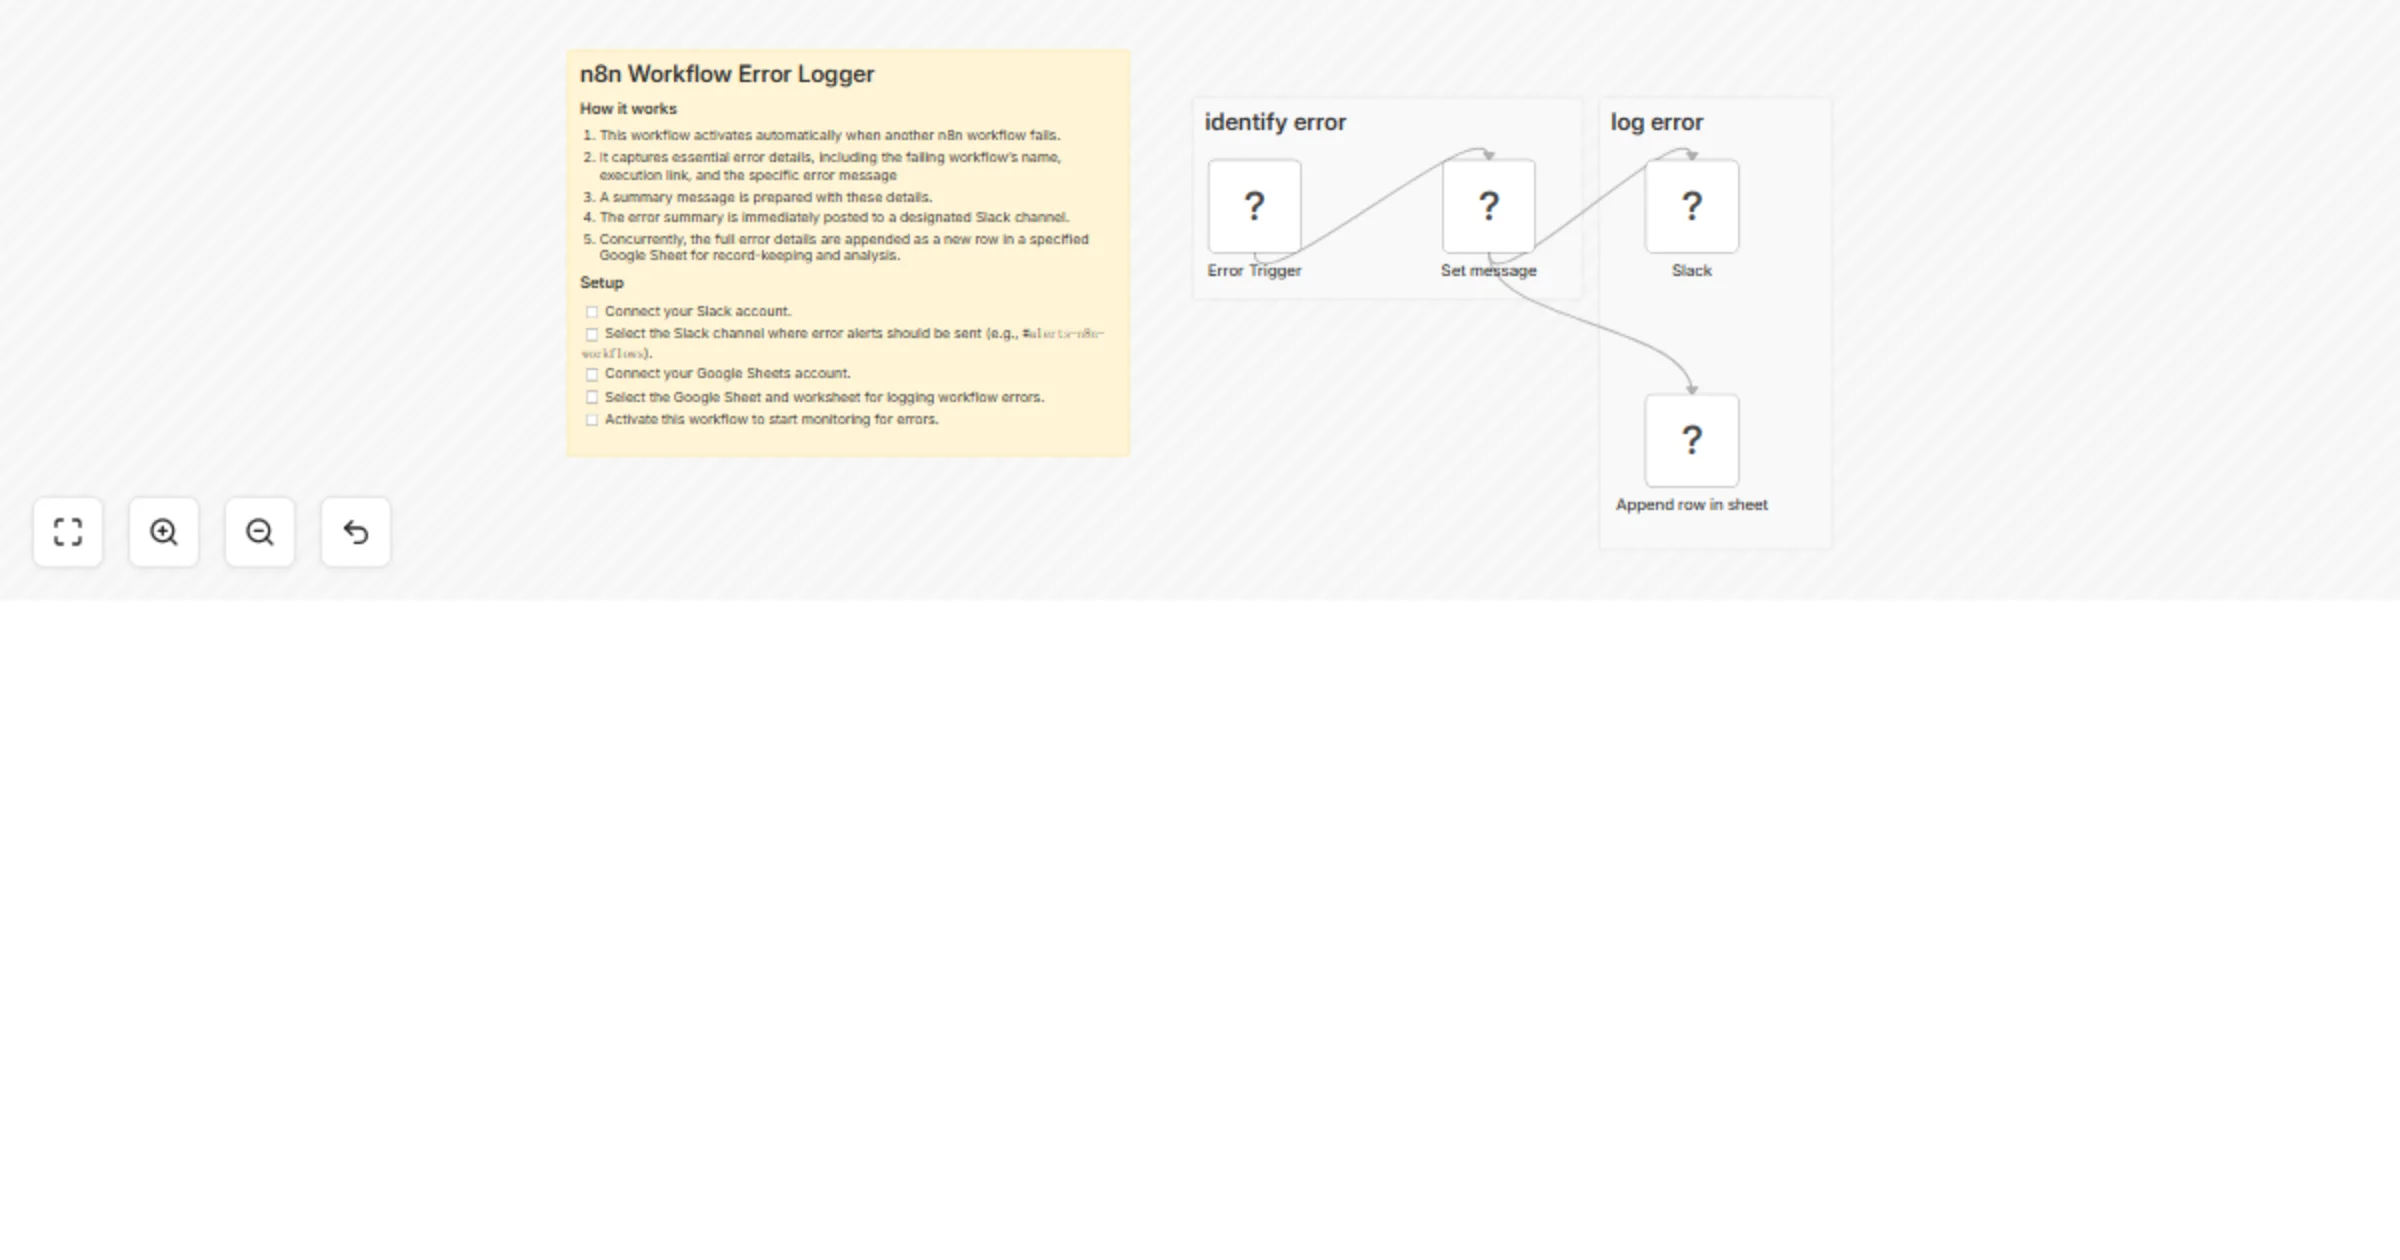
Log workflow errors to Slack and Google Sheets
Who’s it for This template is for teams using n8n in production who want immediate visibility into workflow failures....